


The indicator is designed for manual multi-currency trading using the Three Elder Screens system.
The indicator works with any symbols located in the MT4 Market Overview window – currencies, metals, indices, etc.
The number of tools is limited only by the bit depth of the MT4 parameters. But if you want, you can create several windows with a different set of tools and parameters.
The indicator uses a modified Three-Screen system, according to which the trend direction is determined on the third screen by the indicators Awesome Oscillator, Moving Average, Stochastic Oscillator at the trader’s choice. The second one determines the oversold/overbought level according to the Stochastic indicator. At the first stage, the Stochastic indicator is used again, but this time to determine the best entry point into the market. As a result, we get rid of the need to move pending orders behind the market (which is provided by the classical system), and we can immediately enter the market.
The indicator will be interesting for those who prefer multi-currency trading.
When working on the Three Elder Screens system, you need to analyze three time periods for each instrument. And it takes a lot of time to work with a large number of tools. To facilitate this work, this indicator was created. It independently analyzes all the selected instruments for three time periods and, when finding the desired combination of parameter values, warns the trader about the possibility of making a deal.
[spoiler title=”Read More…”]
The trader only needs to set in the settings by which parameters the indicator will check the instruments for the possibility of making a deal.
The indicator informs the trader about the possibility of making a trade by displaying a pop-up message on the screen, sending a message to an email, to a mobile terminal, or simply playing an audio file.
The indicator works with current prices (uses a zero bar).
To reduce the load on the processor, it is possible to configure the period for redrawing the indicator indicators.
- Indicator_Position / position of the indicator
- myPosition – the location of the indicator in the main chart window (bottom left, bottom right)
- Visible_Symbols / visible tools
- Symbols-enter tracking tools (separated by commas, without spaces)
- Third_screen_Settings / settings for the third screen
- ThTrendAO – trend direction according to the Awesome Oscillator indicator on the third screen (true-use, false-no)
- ThTrendMA – trend direction according to the Moving Average indicator on the third screen (true-use, false-no)
- ThCrossMA-finding the price above/below the Moving Average indicator line on the third screen (true-use, false-no)
- ThTrendSt – trend direction according to the Stochastic Oscillator indicator on the third screen (true-use, false-no)
- ThCrossStLev-finding the main indicator of the Stochastic Oscillator indicator above/below the overbought/oversold level on the third screen (true-use, false-no)
- ThTF – time period in minutes on the third screen (1440=D1, 240=H4, 60=H1, etc.)
- Second_screen_Settings / settings for the second screen
- SeTrendSt – trend direction according to the Stochastic Oscillator indicator on the second screen (true-use, false-no)
- SeCrossStSig-the main line of the Stochastic Oscillator indicator crosses the signal line on the second screen (true-use, false-no)
- SeCrossStLev-finding the main indicator of the Stochastic Oscillator indicator above/below the overbought/oversold level on the second screen (true-use, false-no)
- SeTF – time period in minutes on the second screen (1440=D1, 240=H4, 60=H1, etc.)
- First_screen_Settings / settings for the first screen
- FiTrendSt – trend direction according to the Stochastic Oscillator indicator on the first screen (true-use, false-no)
- FiCrossStSig-the main line of the Stochastic Oscillator indicator crosses the signal line on the first screen (true-use, false-no)
- FiCrossStLev-finding the main indicator of the Stochastic Oscillator indicator above/below the overbought/oversold level on the first screen (true-use, false-no)
- FiTF – time period in minutes on the first screen (1440=D1, 240=H4, 60=H1, etc.)
- iMA_Settings / settings of the Moving Average indicator
- MAPeriod – The averaging period for calculating the indicator
- MAMethod-Averaging method
- MAAppliedPrice – The price used
- iStochastic_Settings / settings of the Stochastic Oscillator indicator
- StKPeriod – period (number of bars) for calculating the %K line
- StDPeriod – averaging period for calculating the %D line
- StSlowing – the deceleration value
- StMethod-averaging method
- StPriceField – parameter for selecting prices for calculation
- StHighLevel – overbought level
- StLowLevel – oversold level
- Alert_Settings / Notification settings
- UseAlert – use the popup window (true-use, false-no)
- UseSendMail – use sending notifications to an email address (true-use, false-no)
- UseSendPush – use sending notifications to the mobile terminal (true-use, false-no)
- UseSound – use an audio notification (true-use, false-no)
- UseSoundFile – path to the audio file
- StepAlertMin – step of repeated notification in minutes
- StepCalcSec – the step of re-calculating functions in seconds (redrawing the indicator)
- Color_scheme / Color scheme
- ClrTips-color selection for labels and indicator grid
- ClrText-color selection for symbols of instruments and periods
- ClrUp-color selection for a bullish trend signal
- ClrDown-color selection for a bearish trend signal
- ClrNt-color selection for a neutral signal
- ClrOff-color selection for the disabled signal
- myPosition – the location of the indicator in the main chart window (bottom left, bottom right)
- Symbols-enter tracking tools (separated by commas, without spaces)
- ThTrendAO – trend direction according to the Awesome Oscillator indicator on the third screen (true-use, false-no)
- ThTrendMA – trend direction according to the Moving Average indicator on the third screen (true-use, false-no)
- ThCrossMA-finding the price above/below the Moving Average indicator line on the third screen (true-use, false-no)
- ThTrendSt – trend direction according to the Stochastic Oscillator indicator on the third screen (true-use, false-no)
- ThCrossStLev-finding the main indicator of the Stochastic Oscillator indicator above/below the overbought/oversold level on the third screen (true-use, false-no)
- ThTF – time period in minutes on the third screen (1440=D1, 240=H4, 60=H1, etc.)
- SeTrendSt – trend direction according to the Stochastic Oscillator indicator on the second screen (true-use, false-no)
- SeCrossStSig-the main line of the Stochastic Oscillator indicator crosses the signal line on the second screen (true-use, false-no)
- SeCrossStLev-finding the main indicator of the Stochastic Oscillator indicator above/below the overbought/oversold level on the second screen (true-use, false-no)
- SeTF – time period in minutes on the second screen (1440=D1, 240=H4, 60=H1, etc.)
- FiTrendSt – trend direction according to the Stochastic Oscillator indicator on the first screen (true-use, false-no)
- FiCrossStSig-the main line of the Stochastic Oscillator indicator crosses the signal line on the first screen (true-use, false-no)
- FiCrossStLev-finding the main indicator of the Stochastic Oscillator indicator above/below the overbought/oversold level on the first screen (true-use, false-no)
- FiTF – time period in minutes on the first screen (1440=D1, 240=H4, 60=H1, etc.)
- MAPeriod – The averaging period for calculating the indicator
- MAMethod-Averaging method
- MAAppliedPrice – The price used
- StKPeriod – period (number of bars) for calculating the %K line
- StDPeriod – averaging period for calculating the %D line
- StSlowing – the deceleration value
- StMethod-averaging method
- StPriceField – parameter for selecting prices for calculation
- StHighLevel – overbought level
- StLowLevel – oversold level
- UseAlert – use the popup window (true-use, false-no)
- UseSendMail – use sending notifications to an email address (true-use, false-no)
- UseSendPush – use sending notifications to the mobile terminal (true-use, false-no)
- UseSound – use an audio notification (true-use, false-no)
- UseSoundFile – path to the audio file
- StepAlertMin – step of repeated notification in minutes
- StepCalcSec – the step of re-calculating functions in seconds (redrawing the indicator)
- ClrTips-color selection for labels and indicator grid
- ClrText-color selection for symbols of instruments and periods
- ClrUp-color selection for a bullish trend signal
- ClrDown-color selection for a bearish trend signal
- ClrNt-color selection for a neutral signal
- ClrOff-color selection for the disabled signal
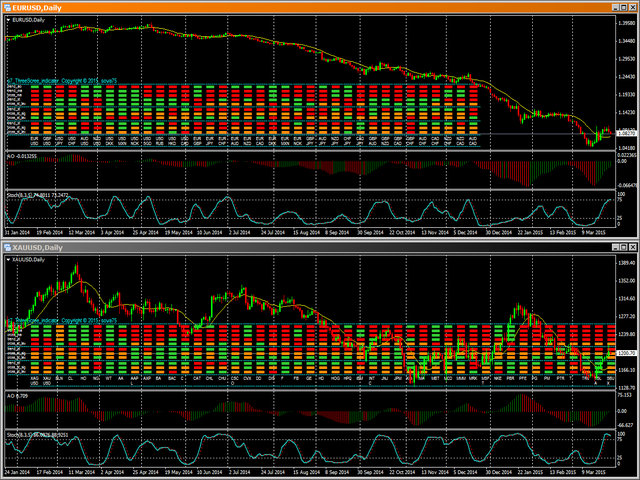
- green is a buy signal;
- red is a sell signal;
- orange is a neutral signal;
- gray – the parameter is disabled.
An example of trading using this indicator is shown in the pictures below.
The indicator was specially designed to participate in the traders ‘ competition using manual trading using the Elder’s Three-Screen system (the results can be seen in the last picture).
[/spoiler]