


The OandaX series of products is designed to display additional data on orders and positions provided by the Oanda FxLabs service.
The OandaX Download Manager Advisor is included in the OandaX product suite and is designed to download data for all OandaX indicators running in the terminal.
To test trading strategies and analyze historical data, you can download data using the free OandaX 5 Download Manager BETA. It is fully functional, but provides data with a delay of a day.
To test trading strategies and analyze historical data, you can download data using the free OandaX 5 Download Manager BETA. It is fully functional, but provides data with a delay of a day.
Attention. The Expert Advisor uses WebRequest from an external server. To be able to download data, you must allow WebRequest in the terminal settings and specify the address in the allowed ones.
Attention. The Expert Advisor uses WebRequest from an external server. To be able to download data, you must allow WebRequest in the terminal settings and specify the address in the allowed ones.
At the moment, the Expert Advisor supports working with the following data:
[spoiler title=”Read More…”]
- The ratio of sellers and buyers (Position Ratio). This is the ratio of the number of customers who have a net position to buy and sell.
- Order Book (Orderbook) or Open Orders. This is a histogram that shows the distribution of limit and stop orders by price levels. Limit orders include Buy Limit orders and Take Profit levels. Stop orders include Sell Limit andStop Loss.
- Book of positions or Open Positions. This histogram shows the distribution of prices at which active positions of traders were opened at the time of the formation of the histogram.
The above information is available for 16 instruments: AUDJPY, AUDUSD, EURAUD, EURCHF, EURGBP, EURJPY, EURUSD, GBPCHF, GBPJPY, GBPUSD, NZDUSD, USDCAD, USDCHF, USDJPY, XAUUSD, XAGUSD.
Historical data is available for all instruments. The minimum step of historical data is 20 minutes.
Already downloaded historical information is available to indicators without running the Expert Advisor, so if you have a history of data, you can check strategies using OandaX indicators in the standard strategy tester.
If several Expert Advisors are running in the terminal, only one of them will download the data and show the summary table of statuses, the others will only display the Order (Position) Book, if this is specified in the settings.
- History depth to download – for what period to download data for those tools that do not have a downloaded history yet. If the history is already there, the data will swing from the time of the latest data available;
- Debug Mode – in this mode, additional entries appear in the terminal log. This setting is to make it easier for me to find errors with your help;
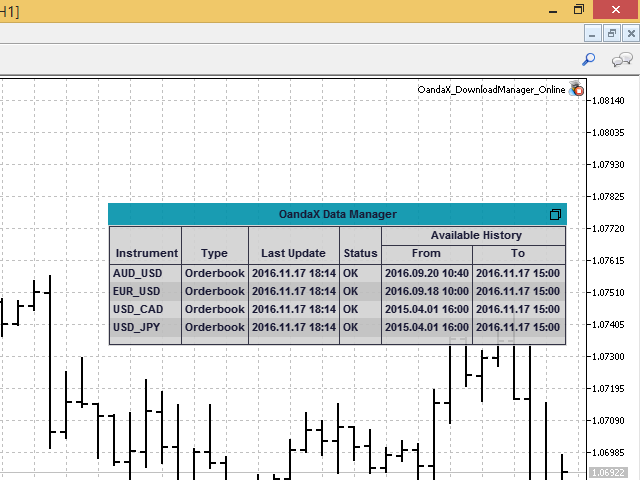
- Show Status Table – show a summary table of statuses. It displays the tasks performed by the Expert Advisor, their type, tool, status of the last download attempt and the interval of the downloaded history;
- Download history from exact date – if you need a very deep history, set True and specify Exact Date if the History depth to download settings are not enough. The history of Market Depth can take up a significant amount of space, so when downloading a deep history, you need to understand that this is a large (really large) amount of traffic and it takes time;
- Exact Date – the date from which the data needs to be downloaded.
- Draw Indicator Image – ifTrue, the most current histogram is drawn;
- Use Custom Instrument – True if you have very non-standard tool names or you need to display the histogram of another tool on the chart;
- Custom Instrument Name – the name of the instrument in the Oanda FxLabs format. For EURUSD – EUR_USD, for Gold, XAUUSD – XAU_USD, for Silver, XAGUSD – XAG_USD;
- UTC Offset – the offset of your server’s time relative to UTC, AUTO by default, or a shift in hours if you need to set manually;
- Show Histogram Cumulative – ifTrue, a cumulative histogram is drawn, that is, the values of the previous ones are added to each subsequent level;
- Show Histogram Difference – ifTrue, a difference histogram is shown, that is, for the horizontal level, not the levels of sales and purchases are shown, but their difference. It also works for cumulative mode;
- Show Orders (Positions if False) – ifTrue, the histogram of orders is shown, if False, the histogram of positions is shown, that is, the distribution by levels of those prices at which the current positions were opened.
[/spoiler]