


An indicator of external candles superimposed on a chart with the time frame you selected.
Visually display
the OHLC levels and the passed ATR value of the current candle and candles in
the history.
OHLC is an abbreviation, literally stands for:
O – open (price
opening of the interval (bar or Japanese candle)).
H – high (the maximum of the interval price).
L – low (minimum of the interval price).
C – close (the closing price of the interval).
This indicator will clearly show the trader the level of opening, closing, as well as the levels
the lows and highs
of the previous external candlesticks (senior periods) superimposed directly on the current chart.
The advantage of working with this indicator is that a trader adds an indicator to the chart of a currency pair
with junior included
the time frame will always be aware of where the last hour, thirty minutes started and closed,
fifteen, five minutes, a day, a week, a month. And at what price the extremes of these periods were recorded.
Everyone knows that a time frame is a period of time considered in the technical analysis of free financial markets,
during
which there is a change in prices and other market data, during the construction of price charts.
[spoiler title=”Read More…”]
In the MetaTrader 4 trading terminal there is a standard option to switch the periods of the chart to switch which
you can simply
press the buttons: M1, M5, M15, M30, H1, H4, D 1, W 1, MN
(time frame period of a month).
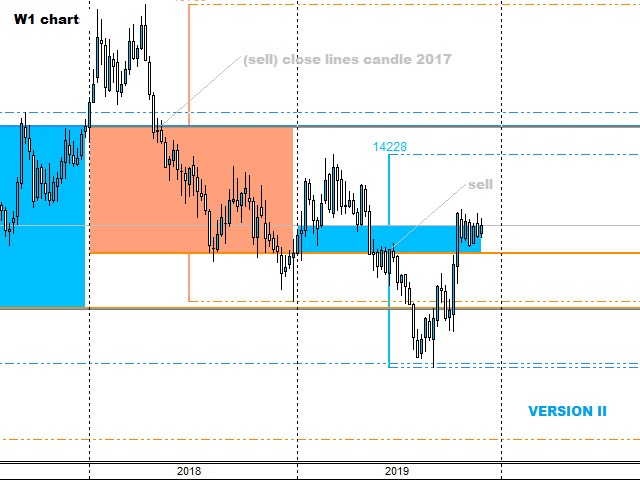
This indicator draws candlesticks older than the currently selected chart period and draws them directly on top of the chart itself.
And also draws
OHLC levels of candles (bars) displayed by the indicator and ATR values
of candles (bars) formed and already formed.
You can enable price tags at all displayed levels in the indicator settings. To know the exact price of the levels and work with it.
Color of the Open and Close lines at the ascending candle – Color of the opening and closing lines on the ascending
candle, default: DodgerBlue
.
Color of the Open and Close lines at the descending candle – Color of the opening and closing lines on the descending candle,
default: DarkOrange.
Width Open Close lines – The thickness of the opening and closing lines of a candle or bar, by default: 2.
Style lines
Open Close at a width of 1 – The style of the opening and closing lines of the candle, with a thickness of 1, by default: Solid.
Lengths line
Open Close High Low – The length of the Open Close High Low line, by default: ray (ray).
Alignment lines for the candle to close –
Alignment of the candle closing price lines, by default: LeftPart.
How many periods forward to draw the cut length – How many periods forward to draw the line if the Cut length is selected
(segment), by default: 3.
On/Off price labels of all lines – On/off price labels of all lines.
On/Off value of ATR of external
candles – On/off value of ATR of external candles.
On/Off High and Low lines – On/off the high
and low lines.
The color of the lines, the style with a thickness of 1, and the thickness of the High and Low lines can also be changed at your discretion.
Note:
The period of indicator candles should be longer than the selected period of the terminal chart.
The indicator will be useful to traders for intraday trading. On time frames: from M1 and above.
If the external candle is not displayed on the lower time frame, update the chart or upload quotes
junior time frames from
the broker’s server.
[/spoiler]