


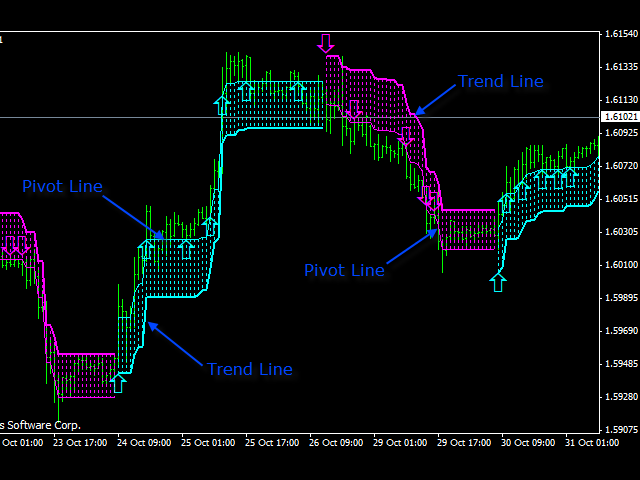

Omega Trend Indicator is an advanced tool specially designed for early detection of market trends, as well as for effective following them. The indicator draws two lines. The main (thick) trend line shows the assumed lower or upper limits of the volatility of the current market trend. A break in the main trend line indicates a potential reversal or change in trend movement. The trend line also indicates the best point to place a stop loss. In the Omega Trend Indicator, the trend line indicates the exact point of the initial stop loss, as well as the direction of movement of the trailing stop. The line is blue for uptrends, and pink for downtrends (see the first screenshot below).
An additional (thin) pivot line represents the estimated pivot level in the market. Breaks of this line can be used for short-term/scalping trades in accordance with the current trend in the market, indicated by the trend line.
The Omega Trend Indicator gives clear and understandable signals (see the second screenshot below), you need to follow several steps to filter out false trading signals. First, you need to be able to recognize an unstable market and try to ignore it. An unstable market is a market with high volatility that does not lead to a general price movement in any direction. These price spikes and sharp rebounds from the boundaries of the range can cause a number of low-quality signals. The third screenshot below shows an example of an unstable market. An unstable market represents the worst conditions for any breakout trading strategy or impulse trading. If you use the Omega Trend Indicator under these conditions, don’t be surprised by the poor results.
[spoiler title=”Read More…”]
The signals of the Omega Trend Indicator indicator are most reliable when there are trend or swing movements on the market. Avoid trading during periods of low liquidity. During these periods, the market is usually in a narrow range. Periods of low liquidity usually occur after the close of the New York trading session and often throughout the Asian session. The best signals from the indicator are usually formed during the New York and London trading sessions (8-21 GMT).
It is recommended to use the Omega Trend Indicator on EURUSD, EURJPY, USDCHF, GBPJPY and GBPUSD pairs. Also, all financial instruments that have a trend movement are suitable. You can use it on all timeframes, for scalping, intraday trading or long-term investments.
It is strongly recommended to adjust the display of the indicator lines on the chart. The default settings are not suitable for all chart periods and all instruments. The most important settings to adjust are: Volatility_Period, TrendLine_Level, PivotLine_Level and Bar_Acceleration.
The default settings are not suitable for all timeframes and all instruments. The most important settings to adjust are: Volatility_Period, TrendLine_Level, PivotLine_Level and Bar_Acceleration.
- Show_Arrows – show/hide signal arrows on the chart.
- Show_Histogram – show/hide the histogram of the indicator.
- Show_PivotLine – show/hide the pivot line.
- Alerts – enable/disable alerts about alarms.
- Send_Push_Notifications – enable/disable sending notifications to a mobile device.
- Volatility_Period – the period of the indicator for calculating volatility.
- ……….
More information and a full list of settings can be found on my blog (in English)!
You can see my other forex robots and indicators in my profile.
Feedback is welcome!
Add me as a friend if you want to receive notifications about my new products!
Add me as a friend if you want to receive notifications about my new products!
[/spoiler]