


This is a multifunctional indicator, it is an oscillator (MASD, Momentum, RSI, MFI) normalized to the Bollinger bands. The normalized oscillator correctly determines overbought and oversold. The oscillator can be displayed as a line, a histogram, or a flooded histogram. The upper and lower Bollinger bands are adjusted independently (period and deviation). This indicator is used by the “Bollinger Bands strategy” Expert Advisor and is provided for convenience in the visual selection of parameters. You can also use it yourself in your trading systems.
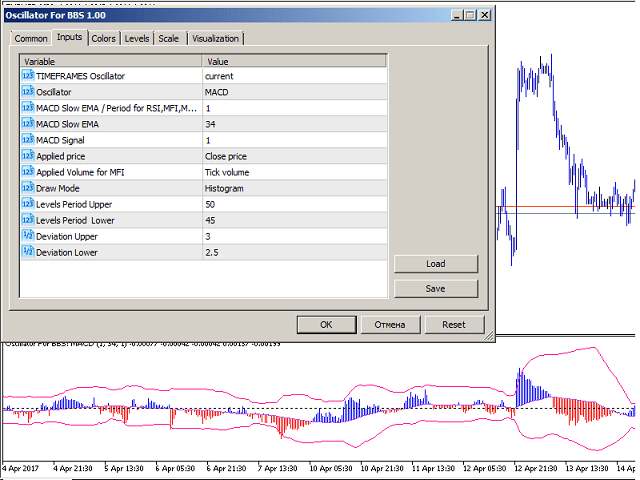
- TAIMEFRAMES Oscillator-indicator timeframe
- Oscillator – type of oscillator ( MASD, Momentum, RSI, MFI)
- MACD Fast EMA/Period for RSI, MFI, Momentum – the period of the oscillator (Momentum, RSI, MFI) or fast EMA for MASD
- MACD Slow EMA-Slow EMA for MACD
- MACD Signal-SMA for MACD
- Applied Price – apply to the price
- Applied Volume for MFI – apply the volume type to the calculation (only for MFI)
- Draw Mode-displays the oscillator (line, histogram, or filled histogram).)
- Levels Period Upper – the period of the upper Bollinger band
- Levels Period Lower – the period of the lower Bollinger band
- Deviation Upper-deviation of the upper Bollinger band
- Deviation Lower-deviation of the lower Bollinger band