


Analyzes market activity by measuring the frequency of incoming ticks. Bullish and bearish ticks are analyzed separately, informing about the prevailing market sentiment at the moment. According to observations, an increase in the frequency of ticks (panic) indicates the beginning of strong price changes, and an increase in the frequency of ticks in a particular direction not only accompanies a price change in this direction, but also often anticipates it.
The indicator is indispensable for scalping.
- High sensitivity of the indicator and low latency. When analyzing ticks, knowing that activity increased five minutes ago is equivalent to not knowing;
- Display as a step graph, allowing you to see the history of frequency changes;
- Displaying the average frequency for previous periods, which increases the information content of the graph;
- Separate display of the frequencies of ascending and descending ticks.
The graph recalculates the values of the indicators 1 time per second. All indicators of the indicator are expressed in 1/min.
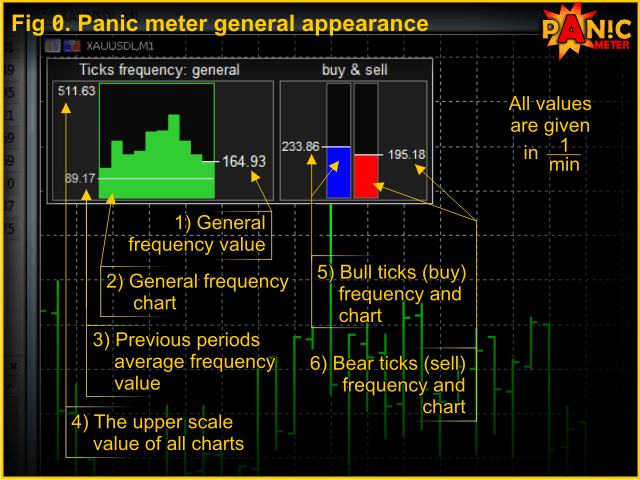
The indicator interface consists of the following elements (see Figure 0):
The indicator does not use input parameters and does not require configuration.
[spoiler title=”Read More…”]
Drag the indicator to the desired chart. At the start, the indicator is displayed in the upper-left corner, but you can move it to the desired location by first selecting it with a double click. The indicator needs 15 ticks to start displaying (the number of ticks remaining before starting is displayed in the header).
[/spoiler]