


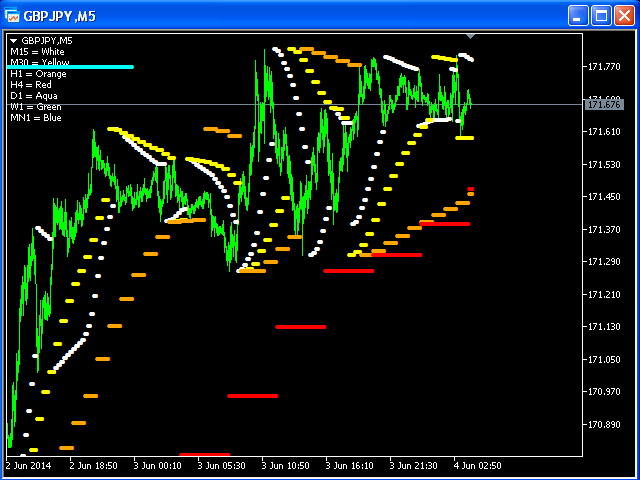

Multi-time frame version of the classic Parabolic SAR indicator (from “Stop and Reverse” – stop and reverse).
The PSAR indicator follows the trend. As soon as the downtrend turns up, the PSAR follows the price like a trailing stop.
You can select the PSAR to display on the chart.
The PSAR is only displayed based on the current or higher timeframe.
Input parameters:
- bM15-PSAR from M15
- bM30-PSAR from M30
- bH1 – PSAR from H1
- bH4-PSAR from H4
- bD1 – PSAR from D1
- bW1-PSAR from W1
- bMN1 – PSAR from MN1
- Step (step) – 0.02
- Maximum (maximum) – 0.2