


This is a professional version of our PipTick Currency Strength indicator. Knowing about the strength and weakness of each of the currencies is very important for every trader trading on the forex market. This indicator measures the strength of eight major currencies (USD, EUR, GBP, CHF, JPY, CAD, AUD, NZD) using several popular indicators. PipTick CSI PRO shows in a simple and accessible form whether the currency is strong or weak. Moreover, it shows when the currency is in the overbought, oversold or “normal” zone.
The indicator uses four ways to measure the strength and weakness of currencies.
- RSI – Relative Strength Index
- CCI – Trading Channel Index
- MFI – Cash Flow Index
- MACD – Convergence/Divergence of Moving Averages
The indicator calculates 28 currency pairs and works on any MT platform. PipTick CSI PRO uses only 7 currency pairs to calculate the remaining 21 pairs. For the indicator to work correctly in the MetaTrader platform, it is necessary to have only these seven pairs: EURUSD, GBPUSD, AUDUSD, NZDUSD, USDJPY, USDCHF and USDCAD.
Note: If the indicator is used in the strategy tester, data on all currency pairs should be downloaded from the Quotes Archive before starting the simulation (Instructions). If it was added to the chart in the usual way, no additional downloads are required.
[spoiler title=”Read More…”]
Interpretation of the indicator
Since PipTick CSI PRO is based on well-known indicators, its interpretation is very simple.
RSI
- Oversold zone – CSI value no more than 30
- The normal zone is the CSI value between 30 and 70
- Overbought zone – CSI value over 70
- Strong currency – CSI value over 50
- Weak currency – CSI value not more than 50
CCI
- Oversold zone – CSI value not more than 100
- The normal zone is the CSI value between -100 and 100
- Overbought zone – CSI value over 100
- Strong currency – CSI value is greater than 0
- Weak currency – CSI value is less than 0
MFI
- Oversold zone – CSI value no more than 30
- The normal zone is the CSI value between 30 and 70
- Overbought zone – CSI value over 70
- Strong currency – CSI value over 50
- Weak currency – CSI value not more than 50
MACD
- Strong currency – CSI value is greater than 0
- Weak currency – CSI value is less than 0
Using PipTick CSI PRO
There are two main approaches to trading based on the strength and weakness of currencies:
- Buying a strong currency and selling a weak one is trading according to the trend. For example, if you see that EUR is strengthening and AUD is weakening, buy a pair of EURAUD. Do not trade if one of the currencies is overbought/oversold.
- Selling a strong currency and buying a weak one is trading against the trend. For example, if USD is overbought and JPY is oversold, sell USDJPY.
You can achieve excellent results when using the concept of oversold/overbought currencies together with price action or candle patterns. All you have to do is wait until some currency enters the overbought/oversold zone and a candlestick pattern appears, for example, a hammer or a shooting star. Of course, this is just one of thousands of possible ways to use the currency strength indicator.
The indicator can be used for long-term, intraday, swing trading or even scalping.
The PipTick CSI PRO indicator can also be used for manual testing on history. You only need to set the parameter “Bars_ago = 0” in the indicator settings and download the historical data of the seven currency pairs that the indicator should calculate.
Main Features
- The indicator shows the strength and weakness of eight major currencies (USD, EUR, GBP, CHF, JPY, CAD, AUD, NZD)
- A simple comparison of one currency with another
- Four methods of calculation
- Overbought and oversold zones for entry and exit
- Works on all timeframes (M1, M5, M15, M30, H1, H4, D1, W1, MN)
- The indicator does not redraw
- History testing (configurable history period)
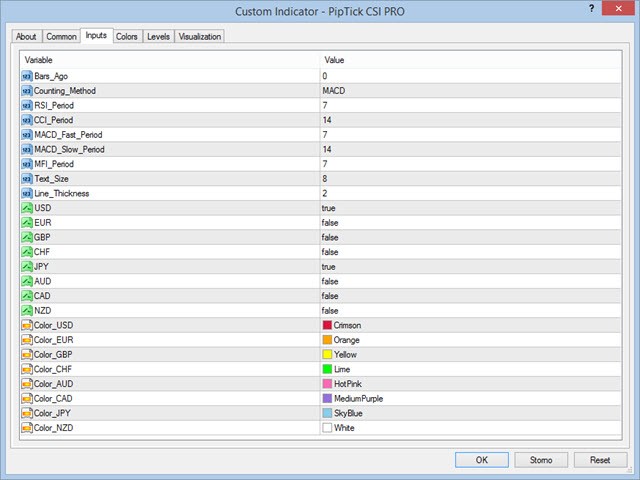
- Customizable parameters (color, line thickness, periods…)
- Excellent results together with the analysis of price action and candlestick patterns
- The perfect tool for scalping
- Very fast calculations
- Works on all timeframes
Output information:
- USD…NZD – CSI value for USD…NZD
PipTick CSI PRO for MT5 is also available.
For more information, visit the PipTick CSI PRO page.
[/spoiler]