


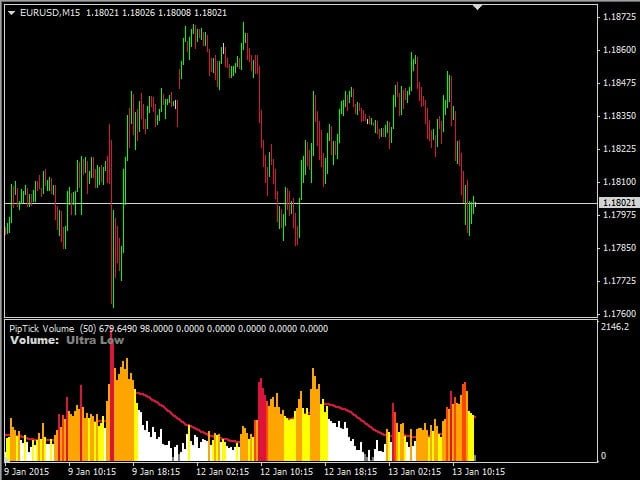

PipTick Volume indicator is a great tool for measuring tick volume or real volume activity. It helps traders to easily and simply estimate the current volume. The indicator uses a moving average and its coefficients to classify the volume. Accordingly, the area where the volume is located (relative to the moving average) is marked as ultra-low, low, medium, high, very high, or ultra-high.
This indicator calculates the moving average in four ways:
- SMA-Simple Moving Average
- SMMA-Smoothed Moving Average
- EMA-Exponential Moving Average
- LWMA-Linear-weighted moving average
By default, there are six zones that the user can change. The bar of the histogram is colored in a certain color, depending on which zone corresponds to the volume. This way, you can easily recognize how high the volume is compared to the previous bars.
- Ultra-low volume zone-grey
- Low volume zone – white color
- Medium volume zone-yellow
- High volume zone-golden color
- The area is very high volume, dark-orange color
- Ultra-high volume zone-crimson color
- Simple classification of volume
- Multiple calculation methods to choose from
- The zone ranges are selected by the user
- Works on any timeframe (M1, M5, M15, M30, H1, H4, D1, W1, and MN)
- Fast and reliable indicator
- Configurable parameters (color, line thickness, MA period, etc.))
- Real and tick volume
[spoiler title=”Read More…”]
- MA_Method-Moving Average, SMA, SMMA, LWMA, and EMA method
- MA_Period – The period for calculating the moving average
- Line_Thickness – The thickness of the output line
- Histogram_Thickness – The thickness of the output histogram
- Low_Coefficient-Coefficient for determining the low zone
- Average_Coefficient-Coefficient for determining the average zone
- High_Coefficient-Coefficient for determining the high zone
- Very_High_Coefficient-Coefficient for determining a very high zone
- Ultra_High_Coefficient-Coefficient for determining the ultrahigh zone
- Color_Text – The color of the indicator text
- Color_MA_Line – the Color of the moving average line
- Color_Ultra_Low – The color of the ultra-low histogram
- Color_Low – Color of the low histogram
- Color_Average – Color of the average histogram
- Color_High – The color of the high histogram
- Color_Very_High – The color of a very high histogram
- Color_Ultra_High – The color of the ultra-high histogram
- Average Volume – Displaying the average volume for the period
- Volume – Displays the values of the volume
- Type – Displays the number of the zone type. 1-6 corresponds to the zones. Number 1 means ultra-low, 6 means ultra-high
- Low – Displays the values of the low zone. Otherwise, the value is zero
- Average – Displaying the values of the middle zone. Otherwise, the value is zero
- High – Displays the values of the high zone. Otherwise, the value is zero
- Very High – Displays the values of a very high zone. Otherwise, the value is zero
- Ultra High – Displays the values of the ultra-high zone. Otherwise, the value is zero
[/spoiler]