


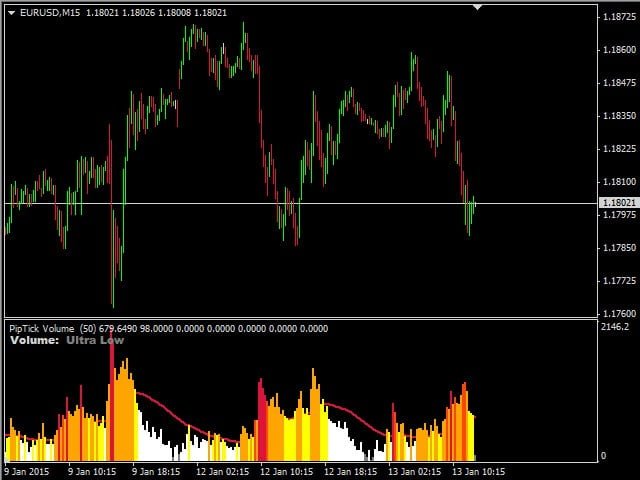

this PipTick volume index is a great tool for measuring tick volume action. It helps traders readily and simply estimate the current volume. The indicator for the classification of the volume size uses moving average and its multiples. hence, the area where the volume is located (relative to the moving average) is marked as ultra-low, low, medium, high, very high, or ultra-high.
This indicator calculates the moving average in four manners:
- SMA-Simple Moving Average
- SMMA-Smoothed Moving Average
- EMA-Exponential Moving Average
- LWMA-Linear-weighted moving average
By default, there are six zones which the user can change. The bar of the histogram is colored in a certain color, depending on which zone corresponds to the volume. This way, you can easily recognize how high the volume is compared to the previous bars.
- Ultra-low volume zone-grey
- Low volume zone – white color
- Medium volume zone-yellow
- High volume zone-golden color
- Very high volume zone-dark orange color
- Ultra-high volume zone-crimson color
- A simple breakdown of volume
- Multiple calculation methods to choose from
- The zone ranges are selected by the user
- Works on any timeframe (M1, M5, M15, M30, H1, H4, D1, W1, and MN)
- Fast and reliable indicator
- Configurable parameters (color, line thickness, MA period, etc.))
[spoiler title=”Read More…”]
- MA_Method-Moving Average, SMA, SMMA, LWMA, and EMA method
- MA_Period – The period for calculating the moving average
- Line_Thickness – The thickness of the output line
- Histogram_Thickness – The thickness of the output histogram
- Low_Coefficient-Coefficient for determining the low zone
- Average_Coefficient-Coefficient for determining the average zone
- High_Coefficient-Coefficient for determining the high zone
- Very_High_Coefficient-Coefficient for determining a very high zone
- Ultra_High_Coefficient-Coefficient for determining the ultrahigh zone
- Color_Text – The color of the indicator text
- Color_MA_Line – Color of the moving average line
- Color_Ultra_Low – The color of the ultra-low histogram
- Color_Low – Color of the low histogram
- Color_Average – Color of the average histogram
- Color_High – The color of the high histogram
- Color_Very_High – The color of a very high histogram
- Color_Ultra_High – The color of the ultra-high histogram
- Average Volume – Displaying the average volume for the period
- Volume – Displays the values of volume
- Type – Displays the zone type number. 1-6 corresponds to the zones. Number 1 means ultra-low, 6 means ultra-high
- Low – Display the values of the low zone. Otherwise, the value is zero
- Average – Displaying the values of the middle zone. Otherwise, the value is zero
- High – Display of high zone values. Otherwise, the value is zero
- Very High – Displays the values of a very high zone. Otherwise, the value is zero
- Ultra High – Display the values of the ultra-high zone. Otherwise, the value is zero
For more information, visit the PipTick Volume page.
[/spoiler]