


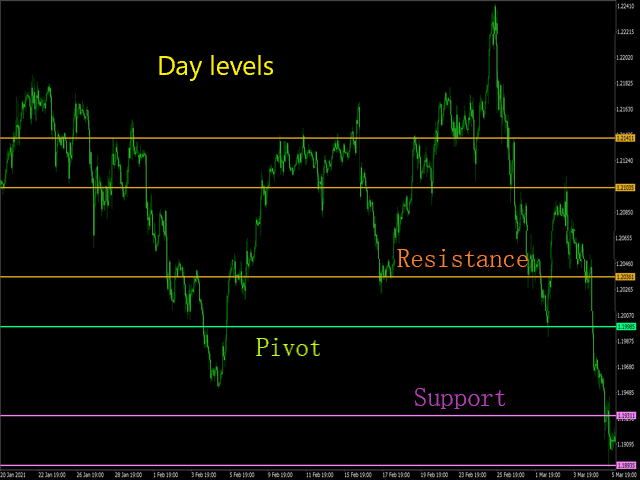

The utility draws pivot levels based on a selection from
- day
- week
- month
The previous candle of the selected timeframe is taken and the values for the levels are calculated using the following formulas:
The previous candle of the selected timeframe is taken and the values for the levels are calculated using the following formulas:
You can adjust the style and thickness for all lines.
The colors for the R, Pivot, and S lines are configured separately.
When the utility is removed from the chart, the lines are removed.
There is also such a utility
It gives you more options.