


The Pivot trend indicator uses the standard calculation of pivot points and some indicators. It is designed to calculate possible trends using pivot points. It also gives an idea of the direction of the trend.
You can use this indicator as a trend indicator. Or with other indicators that are suitable for your strategy.
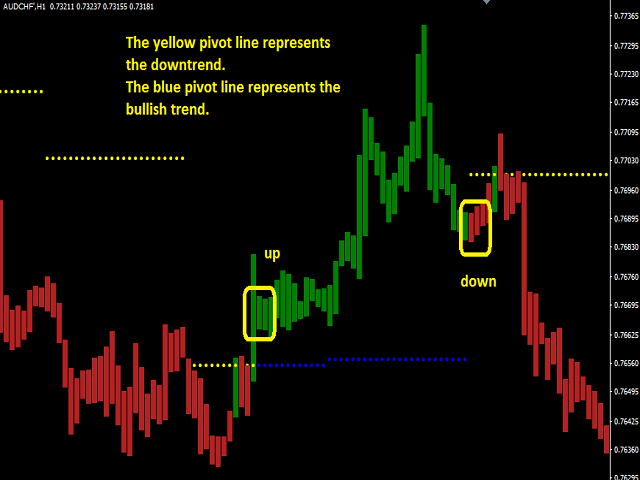
- The green bar represents an uptrend.
- The red bar represents a downtrend.
- The blue pivot point indicates an uptrend.
- A yellow pivot point indicates a downtrend.
- Uptrend
- If the color of the bar is green and the color of the pivot point is blue, an uptrend begins.
- These two colors must appear simultaneously.
- Follow the closing of the bars and act accordingly.
- Downtrend
- If the color of the bar is red and the color of the pivot point is yellow, a downtrend begins.
- These two colors must appear simultaneously.
- Follow the closing of the bars and act accordingly.
- Pivot_Trend_Period – timeframe for calculating the trend.