


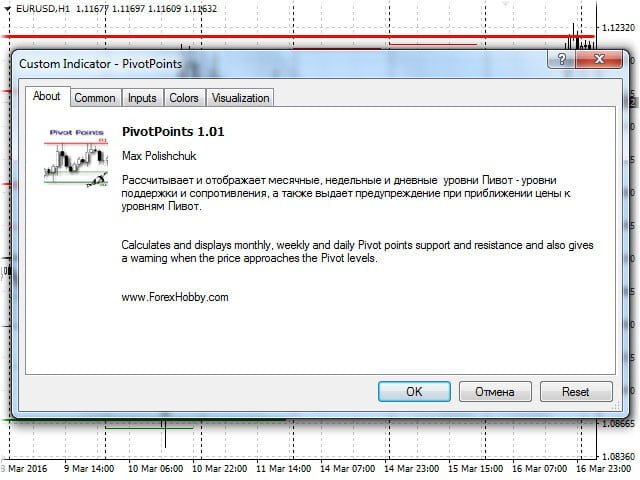

The PivotPoints indicator calculates and displays monthly, weekly and daily support and resistance levels, and also issues a warning when the price approaches the Pivot levels. Pivot points – reversal levels, are used by banks and financial institutions, as they are the levels where it is possible to change the price dynamics, its reversal. Pivot points are the basis of most technical analyses.
The indicator can calculate Pivot levels using the following methods:
- Standard method;
- Camarilla;
- Woodie;
- De Mark.
Designation
- PP – the central level of the Pivot.
- S – support level.
- R – resistance level.
Settings
- Method – method for calculating pivot levels:
– Standard method;
– Camarilla;
– Woodie;
– De Mark.
- Show monthly levels – show / hide monthly levels;
- Show weekly levels – show / hide weekly levels;
- Show daily levels – show / hide the levels of the day;
- Allow showing the message – allow displaying notifications
- Enable sound notification-enable sound notification.
- The name of the sound file – the name of the sound file. Only audio files in WAV format are played. If the field is empty, the standard indicator sound is played. The file must be located:
– in the catalog_terminalsounds directory or its subdirectory.
– in the sql5files terminal_data directory or its subdirectory.
- Offset point for Alerts, pips – how many points before the level to issue a notification.
- Offset point for clearing Alerts, pips – after how many points to” reset ” the notification.
[spoiler title=”Read More…”]
The PivotPoints indicator calculates and displays monthly, weekly and daily support and resistance levels, and also issues a warning when the price approaches the Pivot levels. Pivot points – reversal levels, are used by banks and financial institutions, as they are the levels where it is possible to change the price dynamics, its reversal. Pivot points are the basis of most technical analyses.
The indicator can calculate Pivot levels using the following methods:
- Standard method;
- Camarilla;
- Woodie;
- De Mark.
- PP – the central level of the Pivot.
- S – support level.
- R – resistance level.
- Method – method for calculating pivot levels:
- Show monthly levels – show / hide monthly levels;
- Show weekly levels – show / hide weekly levels;
- Show daily levels – show / hide the levels of the day;
- Allow showing the message – allow displaying notifications
- Enable sound notification-enable sound notification.
- The name of the sound file – the name of the sound file. Only audio files in WAV format are played. If the field is empty, the standard indicator sound is played. The file must be located:
- Offset point for Alerts, pips – how many points before the level to issue a notification.
- Offset point for clearing Alerts, pips – after how many points to” reset ” the notification.
[/spoiler]