


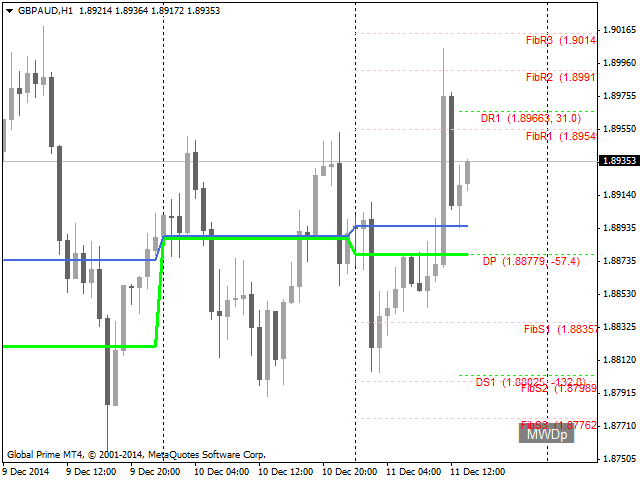

The Pivots indicator is designed to display a reversal on the corresponding timeframes. In addition to reversals, the indicator also displays the daily opening line, support and resistance levels, the ADR Fibonacci levels, and the reversal order.
The Pivots indicator includes an intelligent algorithm to exclude Sunday candles if your broker has them.
Reversals are significant price levels that can serve as support, resistance, or breakout levels.
- textFont-the placemark font.
- textSize – font size.
- textColor – the color of the text.
- MaxBars – the number of candles, information on which the Pivots indicator shows, if necessary, reduce the value.
- addSundayToMonday – set to true to add Sunday candles, if any, to the next candle on Monday, setting only for the daily timeframe D1.
- showDailyLine – set to true to display the daily reversal level.
- showDailyOpenLine – set to true to display the daily opening line.
- showWeekLine – set to true to display the weekly reversal level.
- showMonthLine – set to true to display the monthly reversal level.
- showDailySR-set to true to display the daily reversal levels of support and resistance.
- showDailyOpenSR-set to true to display the daily opening levels of support and resistance.
- showWeeklySR – set to true to display weekly reversal levels of support and resistance.
- showMonthlySR – set to true to display monthly reversal levels of support and resistance.
- showSRAtOwnBar-set to true for the start of the support and resistance lines at the close of the reversal candle.
- showFibonacci – set to true to display the Fibonacci levels based on the daily ADR value.
- includeDistance-set to true to display the distance to the price in the labels.
- includeValue-set to true to display the level value in its label.
- shiftText… – shift the placemarks to the right in pixels.
- showOrder-set to true to display the order of the main reversal levels (D, W, M) and the price(P).
- showOrderBackground-set to true to display the background for the order.
- orderX – the number of pixels on the X-axis from the lower right corner for the order.
- orderY – the number of pixels on the Y-axis from the lower right corner for the order.
- style… – line style.
- width… – line thickness.
- color… – the color of the lines.
[spoiler title=”Read More…”]
If you are not sure about the settings, start the indicator with the default settings.
If you have any problems, try loading the history for all your symbols before running the indicator on the chart.
If you have any questions, please contact me. I am waiting for your feedback about the indicator. Only with your help can I make even better products for MT4.
[/spoiler]