


A script for plotting tic-tac-toe graphs .
Key features:
- selecting a quote source: quotes supplied by the broker via the MT5 terminal; quotes supplied by the broker via the MT4 terminal; quotes in*. csv files supplied by the Yahoo finance website;
- selecting the price or the logarithm of the price as the source for plotting the chart;
- selecting a range of box sizes;
- selecting the U-turn range (in boxes);
- for quotes delivered by the broker through the MT5 terminal – select the timeframe for plotting the chart.
The maximum number of bars processed by the script is 100,000.
The maximum number of X-O columns on the chart is 100.
So, take into account the recommendations for choosing a timeframe depending on the size of the box:
- A chart with a box size of 1, 2, 3, 4 and a reverse of 3 boxes can be successfully built on a timeframe of 1 minute.
- A chart with a box size of 5 and a reverse of 3 boxes can be successfully built on a timeframe of 2 minutes.
- A chart with a box size of 10 and a reverse of 3 boxes can be successfully built on a timeframe of 5 minutes.
- A chart with a box size of 20 and a reverse of 3 boxes can be successfully built on a timeframe of 15 minutes.
- A chart with a box size of 50, 100,200, 500 and a reverse of 3 boxes can be successfully built on the y-hour timeframe.
[spoiler title=”Read More…”]
Remember, increased volatility on the instrument requires a smaller number of bars to build.
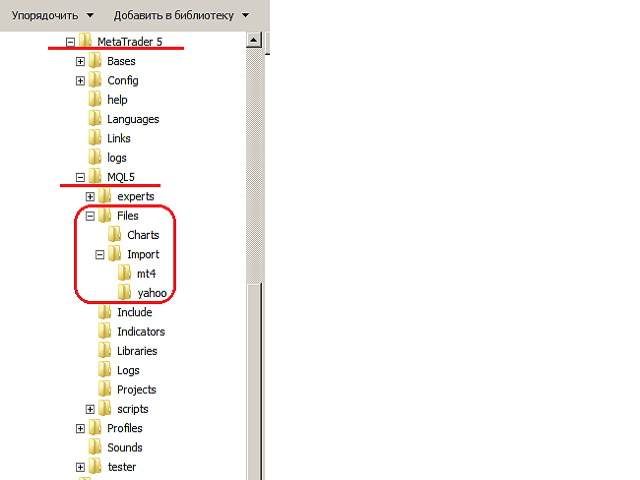
The required directory structure of the terminal is shown in screenshot 1.
Screenshots 2-5 show the process of getting quotes from the Yahoo finance website. By default, the downloaded file will be called table. csv. Do not forget to rename it to a name that is convenient for you.
The script builds charts for all the instruments selected in the market overview window, or for all the files of imported quotes located in the ImportMT4 or ImportYahoo directories.
At the bottom of the chart, directly below the chart for each column is the logarithm of the volume, i.e. (see example below) for the first column is 8.1 – sales volumes were 10^8.1=125 million shares. If there is no information about real (non-tick) trading volumes in the quotes, it will be 0.0.
Below the volume information is the date/time when the extremum was reached in the column (for X – maximum, for O-minimum).
Typical chart:
[/spoiler]