


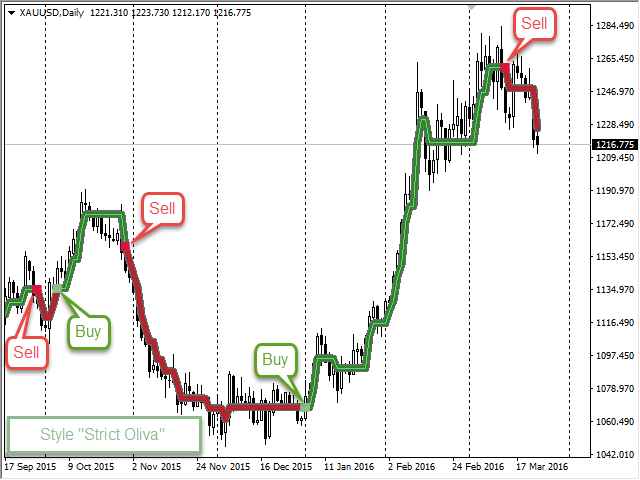

PowerTrender is a directional movement indicator that allows you to determine the trend at the moment of its origin – when the price has not yet gone in the direction of the trend, but is already preparing to change direction. Just follow the color of the indicator: buy when its line changes from red to green and sell when its line changes back to red.
Despite its simplicity and clarity, the internal implementation of PowerTrender is based on digital signal processing algorithms and complex nonlinear price transformations. Thanks to the use of a complex mathematical apparatus, PowerTrender begins to point to a new price movement, when most other indicators show an old, but already actually ended movement. Test PowerTrender in the strategy tester to see for yourself its non-trivial ability to predict the future trend even at the moment of its inception.
List of the main PowerTrender settings that specify the parameters for calculating the indicator:
- Period – the period for calculating the indicator. You should specify small values in the range from 3 to 20.
- Color Sensitivity is the most important parameter. Indicates the “sensitivity” of a change in color or trend direction. The higher the value, the more often the indicator changes color or trend direction. The maximum value of 100.0% indicates absolute sensitivity to the slightest change in the price. A minimum value of 0.0% means that it is completely insensitive to price changes and is never used in practice. Select values between 100.0% and 90.0% in 0.1% increments. The most universal and recommended value is 97.0%.
- Algorithm Type – the type of algorithm used in the calculation. There are two types of algorithm available: Non-linear Dynamics (nonlinear dynamics) and DigitalProcessing (DSP) or digital signal processing. Both algorithms provide different types of smoothing, but the Non-Linear Dynamics type is the most versatile and preferred. It stands as the default type.
[spoiler title=”Read More…”]
The following settings are responsible for the appearance of the indicator:
- Color Theme – the color scheme of the indicator (or ways to color it). There are three different schemes available, which you can see in the screenshots of the indicator attached to this description.
- Size – the size of the indicator. There are three line sizes available: Small, Medium, and Large.
- Chart Foreground-flag indicating the need to show bars in the foreground.
Also, PowerTrender can send push notifications and display special Alert messages when a trend changes. The following settings enable or disable custom notification features:
- Enable Push Notifications – If the parameter value is true, a special information message will be sent to the user’s mobile device when the market trend changes.
- Enable Alert Notifications – If the parameter value is true, a special information line will be displayed in the alerts window when the market trend changes.
[/spoiler]