


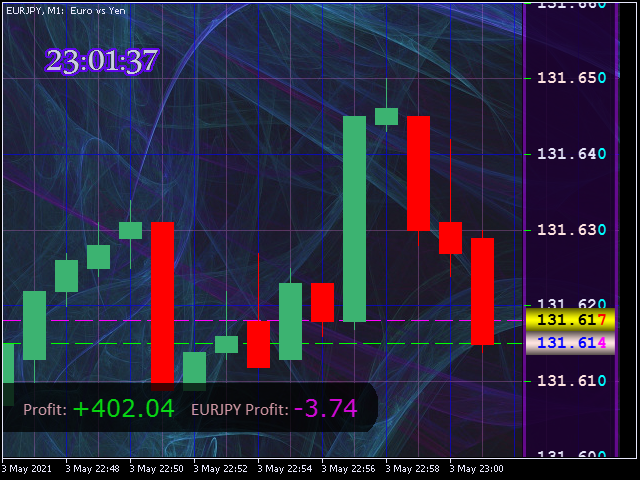

The indicator is designed to replace the standard vertical price scale located on the right side in the chart window of the client terminal with a more convenient price scale with the possibility of detailed adjustment of the display parameters of this scale. In addition, the indicator allows you to make a background fill of the chart window with any image at the user’s request and a two-color grid with elements of its fine-tuning. First of all, the indicator will be useful for traders who do not have the best eyesight, who work on high-resolution monitors and aesthetes who adore maximum visual comfort during long, many hours of work behind the monitor.
All the input parameters of the indicator are divided into ten groups:
The meaning of the wave settings is clear from their names, the input parameter “Background picture” requires a separate clarification, which allows loading background images on the graph. All images whose names are located in the drop-down list of this input parameter before the image ” img_BMP_000.bmp “, and start with the word ” test“, are already loaded into the compiled indicator file and can be used for background fills directly. Images starting with ” img_BMP_000.bmp “and up to” img_BMP_199.bmp “the terminal user must upload it at his own discretion to the folder “MQL5ImagesBG“, which should be created. The dimensions of the images located in the folder should be made based on the resolution of the monitor used. If the image size is smaller than the size of the graph, then it will fill the graph in a texture-tile order, for this reason, the sizes of texture images may be smaller than the size of the graph. The names of the BMP image files to download from the folder should be selected from the list suggested above in order from ” img_BMP_000.bmp “and up to” img_BMP_199.bmp “.
[spoiler title=”Read More…”]
You can edit the images lying in this folder in an external graphic editor directly with the Metatrader terminal running, and it is easiest to analyze the result of this editing after saving it in the folder by simply changing the timeframe of the chart on which this background image is loaded.
It should be noted that the indicator uses a millisecond timer to update the chart with a refresh rate much less than one second (1000 milliseconds). In the situation of checking the indicator in the strategy tester, due to the imposed limitations of the testing mode, this update frequency cannot be lower than one second and as a result, some errors in the operation of the indicator in the tester are quite possible.
The most optimal parameters of the strategy tester:
After installing the indicator on the chart, access to the input parameters window is carried out through the context menu, which is called by clicking on the right mouse button and selecting the menu item” The list of indicators“or by hot keys “Ctrl I“.
On the “Discussion” tab there is a link to the file of the demo, full-featured version of the indicator, which works for half an hour a day.
[/spoiler]