


Price Action Breakout is one of the most popular trading strategies.
The Price Action Breakout indicator is designed using several indicators combined into a single strategy. It is very useful for traders who trade on a breakout. It makes it easier to determine support and resistance levels.
- This price action indicator draws support and resistance levels on the chart, so they will be easier to identify.
- It will inform you about breakouts of support and resistance lines using alerts on the chart and push notifications to your mobile device via the MetaQuotes ID.
- For a beginner or professional trader, it is very useful to know the key support and resistance levels, as well as the overbought and oversold areas.
- It is recommended to use the indicator on pairs with large movements, for example:
- AUDUSD, AUDJPY.
- EURUSD, EURJPY
- GBPUSD, GBPJPY, GBPAUD,
- GOLD and so on.
- It is recommended to use it for intraday trading.
- It should be used on the following timeframes:
- M15
- M30
- H1.
- It has 3 methods for generating signal arrows:
- Support and resistance breakout signal.
- Main Signal1 – Main signal 1.
- Main Signal2 – Main Signal 2.
- It is very effective when used during the European and American trading sessions.
[spoiler title=”Read More…”]
- AUDUSD, AUDJPY.
- EURUSD, EURJPY
- GBPUSD, GBPJPY, GBPAUD,
- GOLD and so on.
- M15
- M30
- H1.
- Support and resistance breakout signal.
- Main Signal1 – Main signal 1.
- Main Signal2 – Main Signal 2.
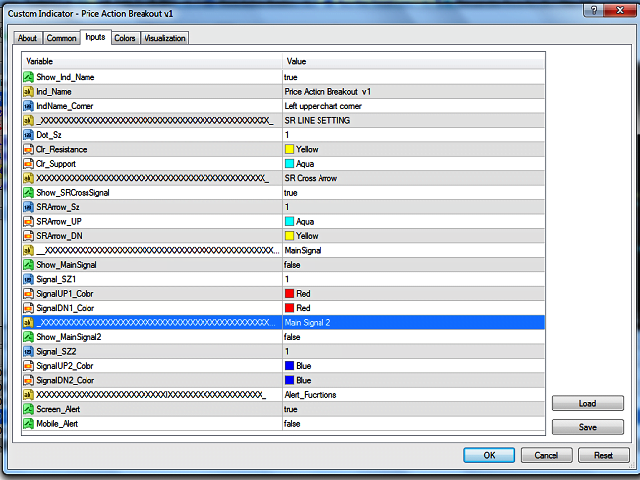
- Show_Ind_Name: true. – show the indicator name on the chart, set the value to false to hide the indicator name from the chart.
- Ind_Name_Corner: Left upper corner. – select the angle at which the indicator name will be displayed.
- Dot_Sz: 1 . – the size of the points of the support and resistance levels, set the value at your discretion.
- Clr_Resistance: Yellow color. – the color of the resistance levels, set the value to your own discretion.
- Clr_Support: Aqua color. – the color of the support levels, set the value to your own discretion.
- Show_SRCrossSignal: true. – show signal arrows after the candle when the price breaks through the support or resistance level. Set false to hide the arrows.
- SR_ArrowSz: 1. – the size of the arrows for signals when the price breaks through the support or resistance level.
- SR_ArrowUP: Aqua. – the color of the arrows for bullish signals, set the value at your discretion.
- SR_ArrowDN: Yellow. – the color of the arrows for bearish signals, set the value at your discretion.
- Show_MainSignal: false. – set false to hide the signal arrows on the chart for MainSignal; set true to show the signal arrows on the chart.
- Signal_Size1: 1 . – the size of the arrows for MainSignal.
- SignalUP1_Color: Red. – the color of the arrows for bullish signals MainSignal, set the value at your discretion.
- SignalDN1_Color: Red. – the color of the arrows for the MainSignal bearish signals, set the value at your discretion.
- Show_MainSignal2: false. – set false to hide the signal arrows on the chart for MainSignal2; set true to show the signal arrows on the chart.
- Signal_Size2: 1 . – the size of the arrows for MainSignal2.
- SignalUP2_Color: Blue. – the color of the arrows for bullish signals MainSignal2, set the value at your discretion.
- SignalDN2_Color: Blue. – the color of the arrows for the MainSignal2 bearish signals, set the value at your discretion.
- Screen_Alert: true. – pop-up notification when a signal occurs.
- Mobile_Alert: false. – notification to the mobile terminal using the MetaQuotes ID when a signal occurs.
[/spoiler]