


This indicator is widely known to readers and
fans of the “turtles” strategy. It is displayed as a line at the lower/upper point of the
price for a certain time interval. The value of the price channel is also
used to determine the support and resistance zones. If the asset quotes
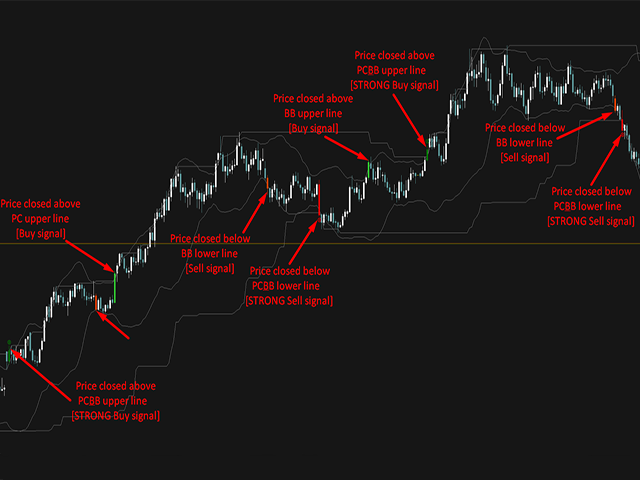
break through and close below/above the channel, then this is a signal of work
towards a breakdown.
It is classically displayed with two lines that
demonstrate the deviation of quotes from MA 20. To do this, the standard
deviation is used, the parameter of which actually sets the dynamics of the two bands. Since the
indicator displays the moment of increased volatility in the market, the closing of
quotes behind the bands indicates the impulse direction of the market or the
exit from the long-term trading zone. Thus, working on a breakdown allows you
to enter at the moment of deviation of the dynamics of quotations from the normative movement, which
may indicate the entry into a position at the very beginning of a set of price positions of a
new trend.
The combination of these two methods allows you to improve the
quality of the forecast, because if the quotes close above the price channel, as well as
the Bollinger bands, this will indicate a breakdown of the key local
level at the time of increased volatility, which further confirms the
impulse movement towards the breakdown. Thus, the formation of a signal
PC