


The Price Pressure indicator is able to determine the overall result of the pressure of buyers/sellers. The result is provided as a percentage of the average true range (ATR). Price Pressure analyzes the price action, determining the amount of available pressure on each candle. The pressure of buyers or sellers is cumulative, and the greater the number and size of bearish / bullish bodies, the more likely it is that the pressure will reach a critical point, overpower the bulls/bears and lead the market down/up. Strong bulls create buyer pressure, and strong bears create seller pressure. Strong bulls and bears are institutional investors, and the combined effect of these strong traders determines the direction of the market.
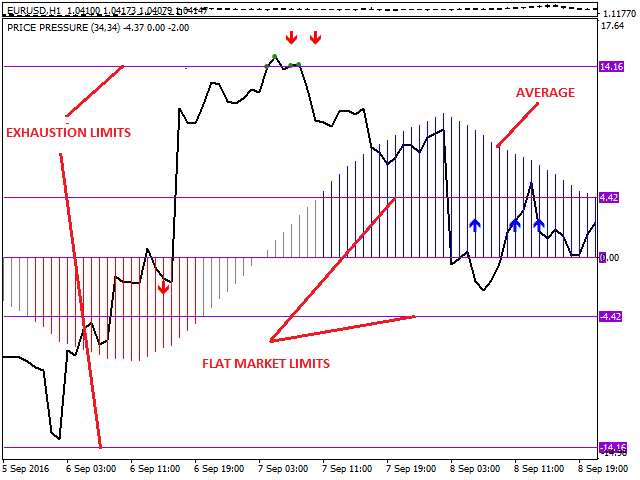
When bulls and bears comfortably open positions, a trendless market is formed. When the average price pressure is in a state of equilibrium, it means that neither bulls nor bears control the market. The Price pressure indicator has limits when determining the flat state of the market. When the average price pressure is within these limits, it is recommended to trade against the market. When the average pressure is outside these limits, there is a trend in the market, and it is recommended to trade in the direction of the trend.
[spoiler title=”Read More…”]
Market exhaustion is an unstable behavior that should be considered as a type of climax, regardless of whether a reversal follows. The market trend is rapidly going up or down, signaling that the culmination and reversal of the market can occur at any moment.
When price pressure indicates a state of market exhaustion, a pullback or even a reversal can be expected.
Price Pressure has a built-in algorithm for automatic calculation of flat states and depletion limits. The algorithm is based on the average absolute deviation, one of the most common ways to search for drop-down values in one-dimensional data.
ATTENTION: Turn off the automatic calculation of limits when starting the tester. When initializing the strategy tester, only 1000 bars are loaded, which is a small sample. It is recommended to use at least 10,000 bars. Using only 1000 bars to calculate the limits will lead to the fact that the calculations will incorrectly reflect the state of the market.
ATTENTION: Turn off the automatic calculation of limits when starting the tester. When initializing the strategy tester, only 1000 bars are loaded, which is a small sample. It is recommended to use at least 10,000 bars. Using only 1000 bars to calculate the limits will lead to the fact that the calculations will incorrectly reflect the state of the market.
- Displays the limits of the flat and depletion state.
- Displays the input signals.
- An adaptive oscillator that works in trending and trendless markets.
- It works on any symbol and timeframe.
- It uses a statistical approach in determining the limits of the state of flatness and exhaustion.
- Period – The number of bars to analyze.
- Average Period – The number of bars to average.
- Show Signals– Show / hide input signals.
- Flat and Exhaustion Limits Automatic Calculation-Enable / disable automatic calculation of the limits of the flat and exhaustion state.
- Flat Market Limit-Manually setting the limits for the flat state. (Used when automatic limit calculation is disabled)
- Exhaustion Market Limit-Manually setting limits for the state of exhaustion. (Used when automatic limit calculation is disabled)
Available buffers:
- Buffer 0 Is The Value Of Price Pressure.
- Buffer 1 is a signal to enter the purchase.
- Buffer 2 is a signal to enter the sale.
- Buffer 3 is a positive average value of Price Pressure.
- Buffer 4 is the neutral average value of Price Pressure.
- Buffer 5 is the negative average value of Price Pressure.
- Buffer 6 is the depletion value of Price Pressure.
[/spoiler]