


The ProfileVolumesMarket indicator calculates tick volumes at each price level in the selected range. Volumes are important for determining the strength, and hence the significance, of price levels. The calculation range is set by the trader by moving two vertical lines. Thus, the indicator allows you to track important levels at different stages of the formation of the price of the instrument. The volume profile histogram can be displayed on the chart (or removed from the chart) by pressing the ” ON ” button. When the chart period changes, the indicator calculation range does not change, which is very convenient when evaluating the accuracy of levels on lower timeframes. The “| | ” button sets the limits of the indicator calculation in the visibility zone of the current chart. The color of the histogram is determined by the position of the current price relative to the maximum level. The ratio and offset parameters allow you to adjust the histogram to the individual preferences of the trader. There are two modes for calculating the indicator. In the ModeTimer mode, the indicator is calculated based on the signals generated by the internal system timer, which allows you to work with it even when the market closes. In ModeTick mode, the indicator is recalculated every minute, which allows you to track the current volume changes and check the indicator’s performance in testing mode. The indicator automatically checks for “holes” in the history of quotes and selects the smallest timeframe with the full history as a basis, while the corresponding information is displayed in the comments.
[spoiler title=”Read More…”]
- Set_Mode-setting the indicator calculation mode;
- ColorLevelNon – the color of the histogram, if the current price is equal to the maximum volume level;
- ColorLevelBull – the color of the histogram if the current price is above the maximum volume level;
- ColorLevelBear – the color of the histogram if the current price is below the maximum volume level;
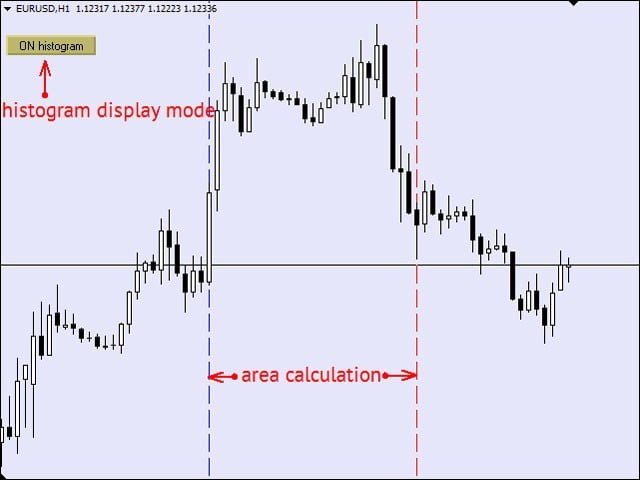
- ColorLineFrom – color of the vertical line at the beginning of the indicator calculation range;
- ColorLineTo – color of the vertical line at the end of the indicator calculation range;
- coeff – coefficient of the histogram display setting;
- ShiftBars – the number of bars of the chart offset to the left.
- ShowComment – show a comment if there are “holes” in the history of quotes of the smallest timeframe.
[/spoiler]