


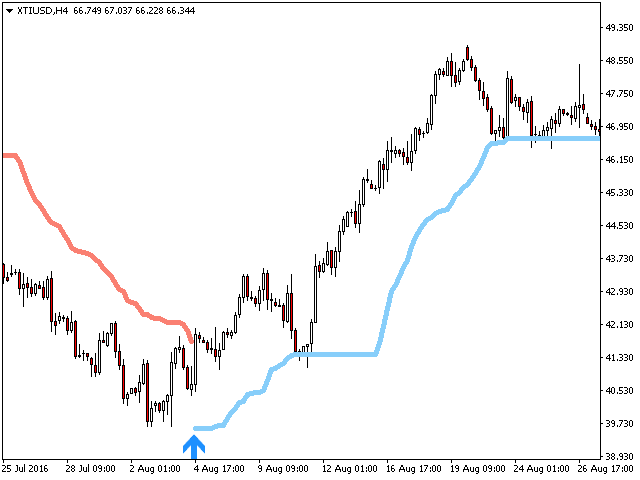

A variant of the famous Bollinger bands that follow the trend and use the moving average and standard deviation to determine the direction of the trend and the moment of its change. Bollinger bands are usually used only as an overbought/oversold indicator, but, in my opinion, they can also be used in an exit strategy.
- Ease of trading
- Customizable colors and sizes
- Does not redraw, does not change values
- Great as a trailing stop
- All types of alerts are available
When you run the indicator on any chart, you will be asked to specify a number of input parameters. Do not despair if it seems to you that there are too many of them. All parameters are grouped into blocks that do not require explanations. That’s what each parameter block does.
- Period – the period of the moving average of the Bollinger bands.
- Deviation – the standard deviation of the Bollinger bands.
- Max History Bars – the number of past bars displayed when loading the indicator.
- Drawing Settings – colors and sizes of arrows.
- Alerts – enable/disable all alerts or set a custom alert text.
Arturo Lopez Perez, private investor, stock speculator, programmer and founder of Point Zero Trading Solutions.