


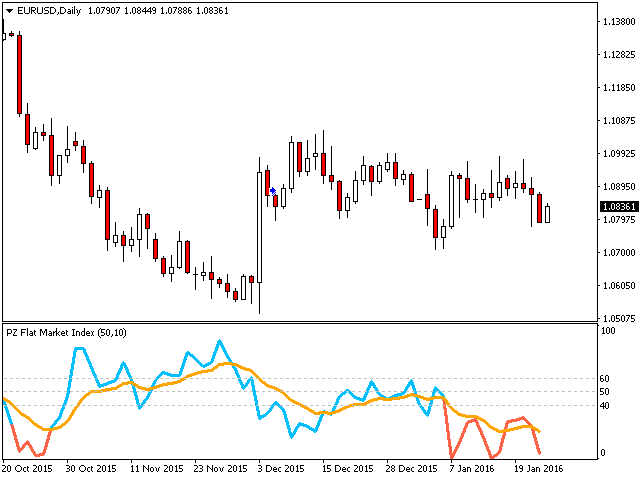

This indicator calculates how much the symbol has moved in relative terms to find trending or flat markets. It
shows what percentage of the last price range is directional. [
Guide
installation Instructions | Manual
update Instructions / Troubleshooting
troubleshooting | FAQ
| All
products ]
- A zero value means that the market is absolutely flat
- A value of 100 means that the market is fully trending
- The blue line means that the price range is healthy
- The red line means that the price range is narrow
- The moving average is a flat market index (FMI)
This has direct trade implications.
- Use trend strategies when the line is blue and above the IGF
- Use range trading strategies when the line is red and below the FMI
- Perform an IGF-based tool selection
This indicator is especially useful to avoid flat markets in your Expert Advisors.
Input parameters
- Max History Bars: the number of bars that you need to look into the past when loading.
- Looking back: the number of bars to study the flat market index.
- Period: The averaging period for calculating the index.
- ATR Period: The ATR period used in the indicator to calculate the unit of movement.
- ATR Multiplier: The ATR multiplier for calculating the unit of movement of the index.
author
Arturo Lopez Perez, private investor and speculator, software engineer and founder of Point Zero Trading Solutions.
[spoiler title=”Read More…”]
This indicator calculates how much the symbol has moved in relative terms to find trending or flat markets. It
shows what percentage of the last price range is directional. [
Guide
installation Instructions | Manual
update Instructions / Troubleshooting
troubleshooting | FAQ
| All
products ]
- A zero value means that the market is absolutely flat
- A value of 100 means that the market is fully trending
- The blue line means that the price range is healthy
- The red line means that the price range is narrow
- The moving average is a flat market index (FMI)
This has direct trade implications.
- Use trend strategies when the line is blue and above the IGF
- Use range trading strategies when the line is red and below the FMI
- Perform an IGF-based tool selection
This indicator is especially useful to avoid flat markets in your Expert Advisors.
- Max History Bars: the number of bars that you need to look into the past when loading.
- Looking back: the number of bars to study the flat market index.
- Period: The averaging period for calculating the index.
- ATR Period: The ATR period used in the indicator to calculate the unit of movement.
- ATR Multiplier: The ATR multiplier for calculating the unit of movement of the index.
Arturo Lopez Perez, private investor and speculator, software engineer and founder of Point Zero Trading Solutions.
[/spoiler]