


This indicator simultaneously evaluates the volatility and direction of the price, detecting the following events.
[ Manual
Installation Instructions | Manual
Update Instructions / Troubleshooting
Troubleshooting | FAQ
| All
products ]
- Drastic and sudden price movements
- Large models of hammers / shooting stars
- Strong breakouts supported by the majority of market participants
- Indecisive but unstable market situations
This is an extremely easy-to-use indicator …
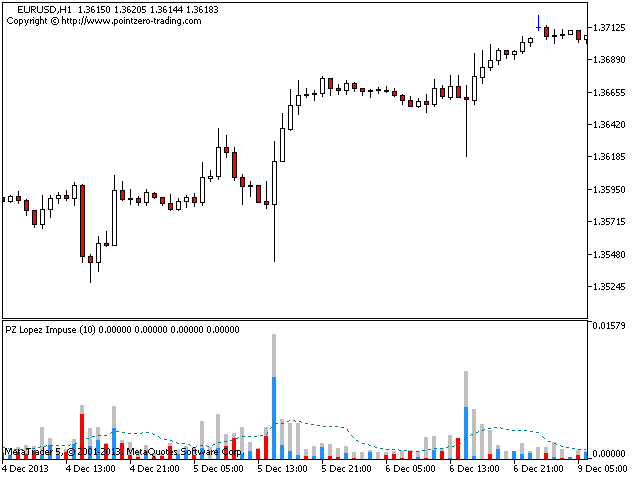
- The blue histogram represents a bullish momentum
- The red histogram represents a bearish momentum
- The gray histogram represents the current volatility
- The moving average is the average volatility
- The indicator implements all types of alerts
- The indicator does not redraw or repaint
… with direct trade consequences.
- You can buy when the bullish momentum exceeds the average volatility
- You can sell when the bearish momentum exceeds the average volatility
This indicator tracks market volatility and bullish and bearish momentum for each individual bar. If bullish momentum
above the average volatility, this is probably a good opportunity to go long as well as short. These strong price points
the moves are reliable because other market participants are likely to cover their positions. This indicator, if its
properly used, very powerful.
author
Arturo Lopez Perez, private investor and speculator, software engineer and founder of Point Zero Trading Solutions.
[spoiler title=”Read More…”]
This indicator simultaneously evaluates the volatility and direction of the price, detecting the following events.
[ Manual
Installation Instructions | Manual
Update Instructions / Troubleshooting
Troubleshooting | FAQ
| All
products ]
- Drastic and sudden price movements
- Large models of hammers / shooting stars
- Strong breakouts supported by the majority of market participants
- Indecisive but unstable market situations
This is an extremely easy-to-use indicator …
- The blue histogram represents a bullish momentum
- The red histogram represents a bearish momentum
- The gray histogram represents the current volatility
- The moving average is the average volatility
- The indicator implements all types of alerts
- The indicator does not redraw or repaint
… with direct trade consequences.
- You can buy when the bullish momentum exceeds the average volatility
- You can sell when the bearish momentum exceeds the average volatility
This indicator tracks market volatility and bullish and bearish momentum for each individual bar. If bullish momentum
above the average volatility, this is probably a good opportunity to go long as well as short. These strong price points
the moves are reliable because other market participants are likely to cover their positions. This indicator, if its
properly used, very powerful.
Arturo Lopez Perez, private investor and speculator, software engineer and founder of Point Zero Trading Solutions.
[/spoiler]