


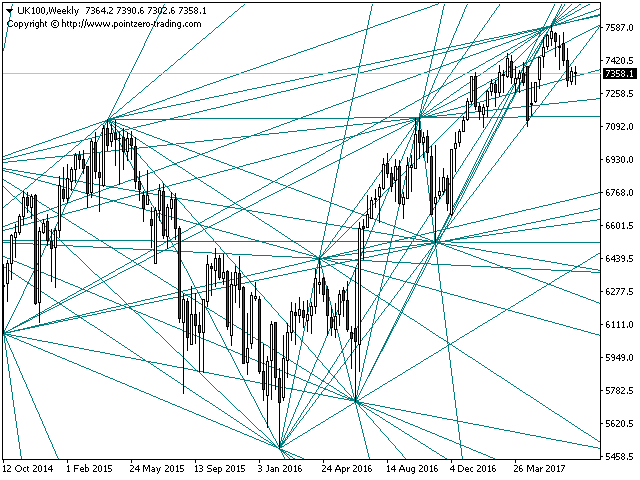

The indicator connects the previous price points by drawing diagonals and
trend lines, which then converge, creating hidden
pivot points.
- Finds hidden pivot points
- Easy to find areas of convergence
- Intersection concentration zones serve as turning points
- Configurable number of lines and price points
- Customizable colors
The indicator draws several lines on the chart. The place of their future
convergence and intersection is a potential pivot point.
The indicator also displays trend lines, channels, and convergence lines
drawn from past prices to current prices, predicting a short-term price
range in the future.
- The price range formed by the merge lines (blue lines) is the predicted short-term price range.
- The diagonal lines themselves don’t mean anything, but if there are many of them
or they intersect each other, it may indicate a hidden
pivot point.
- Period – the minimum size in bars between alternative price
points that are repeated by the indicator. The higher the value, the more the
price points are separated from each other. - Price Points – the number of price points taken from the price history to connect them with lines from the past to the present.
- Ignored Points-disable drawing diagonals to evaluate
how accurate the indicator has been recently. For example, ignoring
the last two price points, you can see whether the last two
price reversals coincided with the last diagonal. - Display Diagonals-display diagonals on the chart. The diagonal is drawn by connecting past price points to each other.
- Depth to display – how many selected price points are associated with
future price points. For example, if you select 10 price points
based on historical data and connect only 3 of them, the 3 earliest
price points will be interconnected in the future, reducing the line density. - Line Color – the color of the diagonal.
- Line Width – the width of the diagonal.
- Display Confluences-display convergence lines on the chart.
The convergence line is taken by connecting the old price point with the current one
It allows you to predict the short-term price
range in the future. - Line Color – the color of the convergence lines.
- Line Width – the width of the convergence lines.
[spoiler title=”Read More…”]
Arturo Lopez Perez, private equity investor, stock speculator, programmer, and founder of Point Zero Trading Solutions.
[/spoiler]