


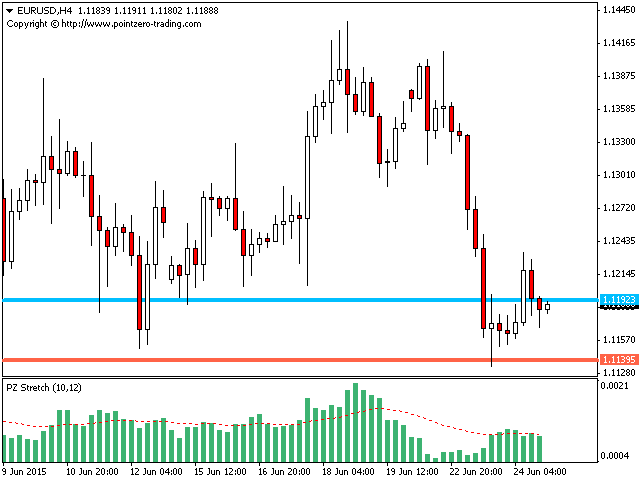

Stretch indicator-price modelToby Crabel, which finds the minimum average value of the price movement/deviation from the opening price in a certain period of time and calculates two breakout levels for each trading day. The calculation is made using a 10-period simple moving average (SMA), which is the absolute difference between the opening price and the price high or low (whichever is lower). The resulting result is used to calculate the breakout thresholds for the current trading session, which are displayed as two lines.
Toby Krabel is a millionaire trader who made his fortune on the commodities exchange and did not know any losses from 1991 to 2002. He is also the author of the bookDay trading with short term price patterns (Day Trading with Short term Price Patterns). Reading this book before using the indicator is highly recommended.
When using this strategy, the trader places a buy stop order directly above the opening price plus Stretch and a sell stop order directly below the opening price minus Stretch. When one of the orders is triggered, the second one becomes a protective stop level.
Craibel’s research shows that the earlier the market entry occurred in the trading session, the higher the probability that the trade will be profitable at the close. A quick start to a trend is always a good opportunity to make money when closing a position. This event should also be taken into account in multi-day trading.
[spoiler title=”Read More…”]
Expanding on Craibel’s research, the more time that has passed since the start of the trading session, the higher the risk, so it is reasonable to reduce the size of the position during the day. Trades opened at the end of the day are the most risky. The later the trade is opened, the lower the probability that the trader will leave it overnight.
If other technical indicators show a strong trend in a certain direction, the trader indicates the preferred trading direction. The position opening level is located only on the side of the expected trend, and when it is reached, a protective stop level is set along with the position opening.
The opening level is calculated in the same way as in the previous strategy: for buying-the opening price plus Stretch, for selling-the opening price minus Stretch.
The most functional parameters of the indicator:
- Strech Timeframe: the timeframe for the calculation of the threshold of breakthrough (default is D1).
- Strech Period: period SMA for the calculation of the threshold of a breakthrough (default is 10).
- Moving Average Period: The period for calculating the average threshold value of the breakout.
- Max. History Bars: The number of bars to calculate. When this value decreases, the speed of the indicator increases.
Arturo Lopez Perez, private equity investor, stock speculator, programmer, and founder of Point Zero Trading Solutions.
[/spoiler]