


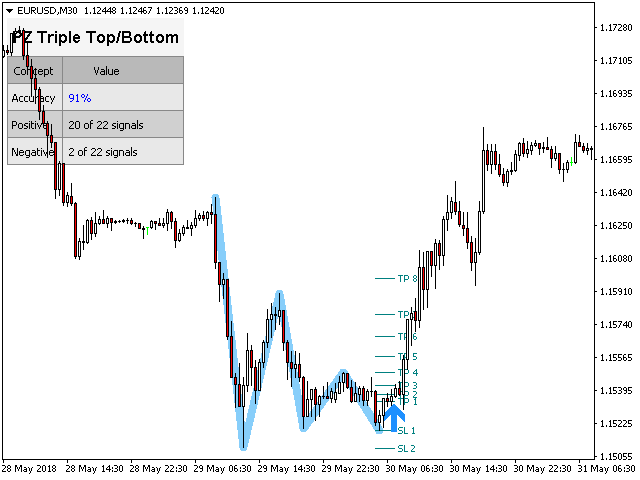

A triple top and bottom pattern is a sort of graphical pattern utilized to forecast a trend change. Pattern
occurs when the price generates three peaks at the same amount. The rally from the resistance near the third peak
is a clear sign buying interest is wearing thin, signaling that a reversal is about to happen. [
The manual
installation instructions | The manual
by upgrade | Elimination
Troubleshooting | FAQ
| All
products ]
- Clear trading signals
- Customizable colors and dimensions
- Implements performance statistics
- Customizable Fibonacci Retracement levels
- Displays the appropriate stop loss and take profit levels
- The indicator can be accustomed to search for continuation or reversal patterns.
- It implements email / audio / visual alerts
These patterns can expand, and the indicator follows the pattern by repainting. However, the indicator implements a rotation to
simplify trading: it waits for a Donchian breakout in the right direction before signaling a trade by making its signals
very reliable and mostly non-redrawable.
Input parameters
When loading the indicator on any chart, you will be presented with a set of options as input parameters. Don’t despair if you
you think that there are too many of them, because the parameters are grouped into obvious blocks. This is what each parameter block does.
- Amplitude-The amplitude represents the minimum number of bars between alternative price points. To find the big ones
samples, increase the amplitude parameter. To find smaller samples, reduce the amplitude parameter. You can upload
The indicator is displayed many times on the chart with different amplitudes. - Minimum Retracement – the minimum Fibonacci retracement required for the pattern.
- Maximum. Retracement – the maximum possible Fibonacci retracement in the pattern.
- Retracement Top / Bottom-This parameter describes how “flat” the top or bottom should be.
- Max History Bars – the number of past bars to evaluate when the indicator is loaded on the chart.
- Show Statistics – Show or hide the statistics panel and performance data.
- Show SL / TP Levels-Show or hide the appropriate SL and TP levels for each signal.
- Drawing options – Colors and sizes for bullish or bearish lines and labels, as well as font sizes.
- Breakouts – Colors and sizes of the breakout arrows.
- Alerts – you can Enable or disable alerts as desired.
author
Arturo Lopez Perez, private investor and speculator, software engineer and founder of Point Zero Trading Solutions.
[spoiler title=”Read More…”]
A triple top and bottom pattern is a sort of graphical pattern utilized to forecast a trend change. Pattern
occurs when the price generates three peaks at the same amount. The rally from the resistance near the third peak
is a clear sign buying interest is wearing thin, signaling that a reversal is about to happen. [
The manual
installation instructions | The manual
by upgrade | Elimination
Troubleshooting | FAQ
| All
products ]
- Clear trading signals
- Customizable colors and dimensions
- Implements performance statistics
- Customizable Fibonacci Retracement levels
- Displays the appropriate stop loss and take profit levels
- The indicator can be accustomed to search for continuation or reversal patterns.
- It implements email / audio / visual alerts
These patterns can expand, and the indicator follows the pattern by repainting. However, the indicator implements a rotation to
simplify trading: it waits for a Donchian breakout in the right direction before signaling a trade by making its signals
very reliable and mostly non-redrawable.
Input parameters
When loading the indicator on any chart, you will be presented with a set of options as input parameters. Don’t despair if you
you think that there are too many of them, because the parameters are grouped into obvious blocks. This is what each parameter block does.
- Amplitude-The amplitude represents the minimum number of bars between alternative price points. To find the big ones
samples, increase the amplitude parameter. To find smaller samples, reduce the amplitude parameter. You can upload
The indicator is displayed many times on the chart with different amplitudes. - Minimum Retracement – the minimum Fibonacci retracement required for the pattern.
- Maximum. Retracement – the maximum possible Fibonacci retracement in the pattern.
- Retracement Top / Bottom-This parameter describes how “flat” the top or bottom should be.
- Max History Bars – the number of past bars to evaluate when the indicator is loaded on the chart.
- Show Statistics – Show or hide the statistics panel and performance data.
- Show SL / TP Levels-Show or hide the appropriate SL and TP levels for each signal.
- Drawing options – Colors and sizes for bullish or bearish lines and labels, as well as font sizes.
- Breakouts – Colors and sizes of the breakout arrows.
- Alerts – you can Enable or disable alerts as desired.
author
Arturo Lopez Perez, private investor and speculator, software engineer and founder of Point Zero Trading Solutions.
A triple top and bottom pattern is a sort of graphical pattern utilized to forecast a trend change. Pattern
occurs when the price generates three peaks at the same amount. The rally from the resistance near the third peak
is a clear sign buying interest is wearing thin, signaling that a reversal is about to happen. [
The manual
installation instructions | The manual
by upgrade | Elimination
Troubleshooting | FAQ
| All
products ]
- Clear trading signals
- Customizable colors and dimensions
- Implements performance statistics
- Customizable Fibonacci Retracement levels
- Displays the appropriate stop loss and take profit levels
- The indicator can be accustomed to search for continuation or reversal patterns.
- It implements email / audio / visual alerts
These patterns can expand, and the indicator follows the pattern by repainting. However, the indicator implements a rotation to
simplify trading: it waits for a Donchian breakout in the right direction before signaling a trade by making its signals
very reliable and mostly non-redrawable.
When loading the indicator on any chart, you will be presented with a set of options as input parameters. Don’t despair if you
you think that there are too many of them, because the parameters are grouped into obvious blocks. This is what each parameter block does.
- Amplitude-The amplitude represents the minimum number of bars between alternative price points. To find the big ones
samples, increase the amplitude parameter. To find smaller samples, reduce the amplitude parameter. You can upload
The indicator is displayed many times on the chart with different amplitudes. - Minimum Retracement – the minimum Fibonacci retracement required for the pattern.
- Maximum. Retracement – the maximum possible Fibonacci retracement in the pattern.
- Retracement Top / Bottom-This parameter describes how “flat” the top or bottom should be.
- Max History Bars – the number of past bars to evaluate when the indicator is loaded on the chart.
- Show Statistics – Show or hide the statistics panel and performance data.
- Show SL / TP Levels-Show or hide the appropriate SL and TP levels for each signal.
- Drawing options – Colors and sizes for bullish or bearish lines and labels, as well as font sizes.
- Breakouts – Colors and sizes of the breakout arrows.
- Alerts – you can Enable or disable alerts as desired.
Arturo Lopez Perez, private investor and speculator, software engineer and founder of Point Zero Trading Solutions.
[/spoiler]