


The PZ Volatmeter indicator measures volatility in a multi-time frame manner in order to identify flat markets, volatility spikes, and price cycles in the market.
- Trade when the volatility is on your side
- Identify short-term volatility and price spikes
- Find volatility cycles at a glance
- The indicator does not redraw
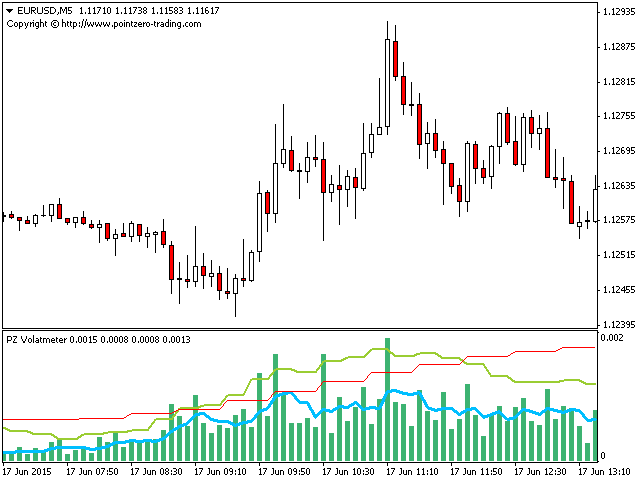
The indicator consists of the following elements…
- The green histogram is the volatility of the current bar
- The blue line is the value of rapid volatility
- The orange line is the value of slow volatility
- The red line is the volatility of the higher timeframe
… and has immediate trading opportunities:
- If the green histogram is above the two lines, then the short-term volatility is extremely high
- If the blue line is higher than the orange line, then the volatility is generally high
- If the orange line is higher than the red line, then the market volatility is high
Zoom out to see the volatility cycle reflected by the red line
Zoom out to see the volatility cycle reflected by the red line
The only functional parameters of the indicator are as follows.
- Fast ATR Period: ATR period for the current timeframe
- Slow ATR Period: ATR period for higher timeframes
[spoiler title=”Read More…”]
Arturo Lopez Perez, private equity investor, stock speculator, programmer, and founder of Point Zero Trading Solutions.
[/spoiler]