


The Quantum VPOC indicator was developed to extend the two-dimensional study of volume and price to a three-dimensional study that includes time. The volume / price / time ratio provides a real insight into the inner workings of the market and the heartbeat of sentiment and risk that drives price action accordingly.
The Quantum VPOC indicator displays several key information elements on the chart as follows:
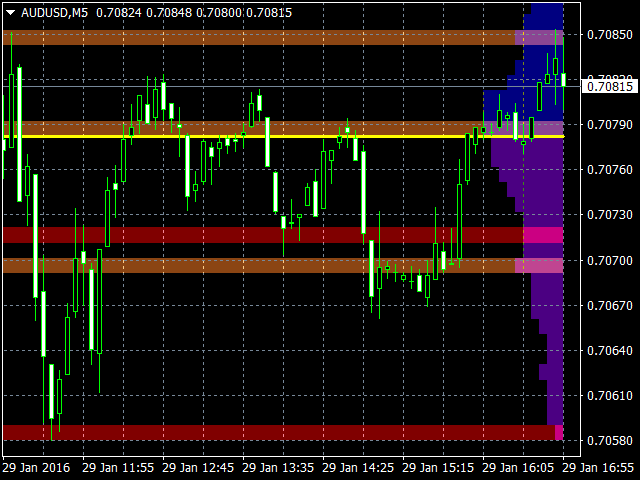
- Volume Profile-displayed as a volume histogram on the vertical price axis on the right side of the chart. Peaks and troughs are clearly displayed, highlighting the highs and lows of volume nodes.
- High volume node (HVN) – here there is a bulge in the volume profile, usually as a result of a long phase of price accumulation. As a result, when the market approaches these areas on the chart, the price action may become boggy with a likely subsequent accumulation, and the node will act as a strong support or resistance area. Since there was a strong price acceptance at this level earlier, this is likely to happen again, and the market will fluctuate in this range. Ultimately, the market may move away from these levels, and any movement through them will confirm the current mood.
- Low volume node (LVN) – there is a low volume in the volume profile. In these zones, the market stops only temporarily – in other words, it is a zone in which the price has previously deviated. Thus, the market is likely to move quickly through these areas with little resistance or support acting to prevent further price declines. The current sentiment is likely to continue moving and rise rapidly after these levels.
- Support and Resistance Zones-are drawn on the nodes of the highs and lows to indicate the different levels of HVN and LVN on the price axis.
- Volume Point of Control Line-it is drawn as a single line on the maximum volume of the High Volume Node of the timeframe and clearly defines the turning point of the mood. It moves dynamically and shows the pivot point of the market sentiment. If it is above the price action, then the current market sentiment is bearish. If it is below the price action, then the current market sentiment is bullish. The VPOC line shows this balance simply, quickly and clearly, allowing you to judge the market mood with accuracy and confidence.
[spoiler title=”Read More…”]
The Quantum VPOC indicator has several unique features, each of which is designed to help you see the inside of the market and trade with the flow, not against it.
- The indicator is dynamic, which means gradually changing the output of information when new volume data appears, so you can be sure that you will get only the most relevant signals.
- The advanced feature includes the ability to change the timeframe of the data source, which is great for multi-timeframe analysis. This gives you the ability to see different timeframes quickly and easily with the appropriate VPOC.
- Both sides of the volume profile are colored differently and are separated by a volume control point line for intuitive and quick chart analysis. The top side is blue by default, and the bottom side is purple by default.
- Two types of support and resistance zones are created, and then they are colored differently again to increase the speed. High-volume nodes (HVN) are colored a lighter shade of orange – low-volume nodes (LVN) are colored a darker shade of orange.
- The number of support and resistance zones is adjustable, and the recommended range is given for them.
- The volume profile bars can be fine-tuned to make them wider or narrower.
- The period (the number of processed bars) can be adjusted at your discretion.
- The volume profile, support and resistance zones, as well as the volume control point lines can be turned on or off at your discretion.
- The colors of the volume profile, support and resistance zones, as well as the lines of the volume control point can be customized to your preferences.
The Quantum VPOC indicator is dynamic, constantly changing with each incoming tick. It works on all timeframes and provides a powerful and much deeper understanding of support and resistance through the lens of volume and the associated high-and low-volume nodes, with the control point itself acting as the market pivot.
[/spoiler]