


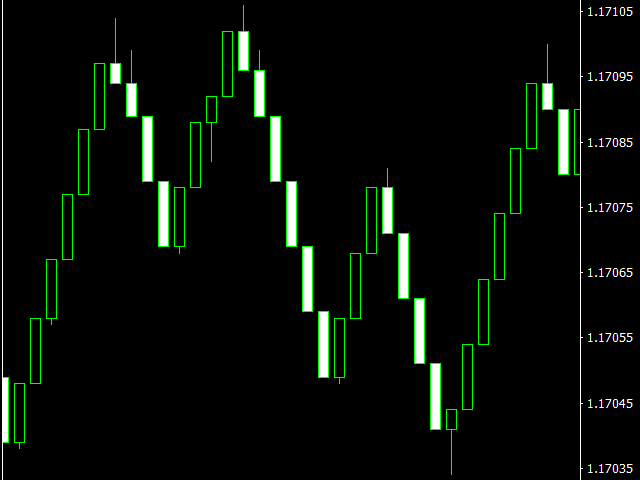

with this indicator, you may create charts of range bars, at which all candlesticks will be this same size and can have shadows. The data
on the range bar chart is spread not from time, but by simply the size of the candle. Each candle represents a price movement, not a period of
time. This works very simply: as long as the price doesn’t move anywhere, a new bar will not be drawn. The size of the bar can be set in the settings by changing the
value of the “Size” parameter. You can attach indicators, Expert Advisors, and scripts to the resulting chart. It turns out a fully working
schedule, on which you can work just as well as on a regular schedule.
The “Range Bar Chart” indicator builds not only on history, but also online. At the same time, the data is updated synchronously with the usual schedule,
there are no delays.
At the same time you can create multiple graphs with the desired size of the bar.
- Size — size of the range bars (in points).
- Chart-timeframe for opening the chart in a separate window. If you are going to work with only one chart for your currency pair,
then the timeframe is not important. When plotting a range bar chart, the timeframe does not affect the calculations. This setting is created in order to
it was possible to open several charts for the same currency pair, but with different settings of the Size parameter. In this case, you need to
set different timeframes for each chart (for example, M2, M3, M4). You also need to set different timeframes at the same time
launch the “Range Bar Chart” indicator and other tools that generate a synthetic chart on the same currency pair.
[spoiler title=”Read More…”]
- Open the Navigator window.
- Drag the indicator to the desired chart (timeframe M1 or older, depending on the value of the Size parameter).
- Open the resulting chart by clicking on the corresponding button – “Open Chart”.
[/spoiler]