


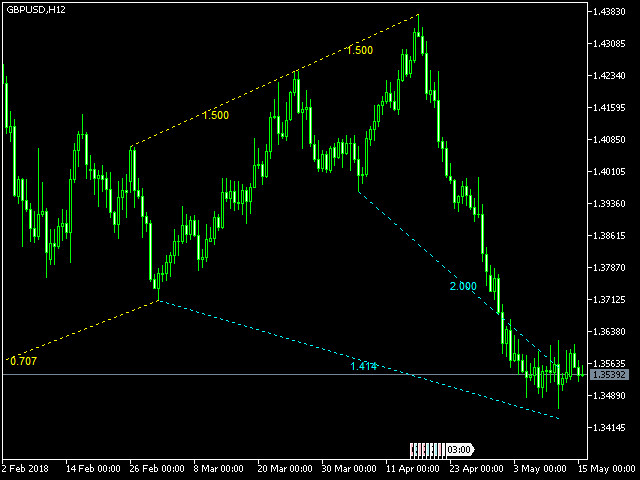

The indicator displays the coefficients between the chart extremes.
You can specify your own coefficients (for example, Fibonacci).
The most important ones
- Density – how detailed the search for coefficients in extremums should be. The higher the value, the less detailed the search, and vice versa. The base unit is 1 bar on the chart.
- History – how deep in the history to search. At -1, the indicator searches for all bars in the history. The base unit is 1 bar on the chart.
- Range – how far from the extremum the coefficients should be searched for. The base unit is 1 bar on the chart.
Important
- Default color / Line style / Line width – color, style, and width of the found coefficient lines.
- List of positive ratios – a list of custom coefficients (for example, Fibonacci) that are searched on the chart. When a match is detected, the line is highlighted.
- Color of positive ratios – the color of the positive coefficients.
- Deviation – the ratio of the real and positive coefficients. Base units-in %.
- Show last extreme bar only-show only the bar with the last extreme bar (history is hidden).
- Show positive ratios only-show only positive ratios (the rest are hidden).
- Show developing ratios on last bar-display the emerging coefficients on the last bar.
- Color of developing ratios – the color of the coefficients being formed.
[spoiler title=”Read More…”]
Other settings
- Your own prefix for objects – all indicator objects are marked with the main prefix ratio_. If you want to use more than one indicator on the same chart, specify a special prefix for each copy. If you are going to use only one indicator, you can leave the parameter empty.
[/spoiler]