


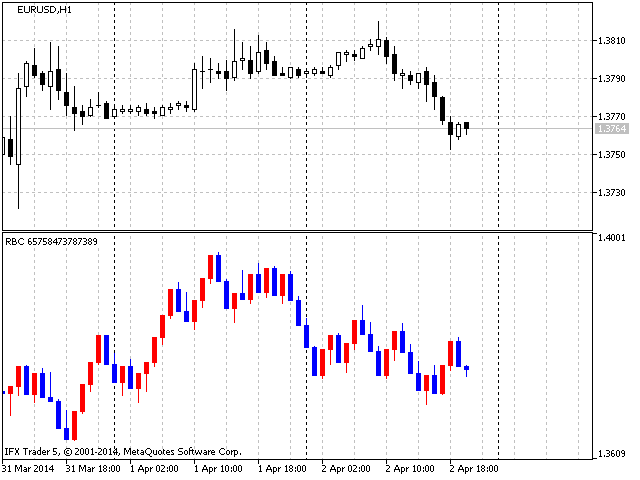

The RBC – Range Bar Chart indicator is a classic indicator for plotting a Range Bar chart. In the indicator there is a choice of prices for which the construction will be carried out: the price pair is the highest/The smallest (High/Low), this is the classic option for analysis. There are also Opening prices (Open), Highest (High), Lowest (Low), and Closing prices (Close). When the first option is selected, two price values are analyzed at once, while the other options use only one. The Range bar chart in its classic version should be built on the basis of tick data, but since there is no such data on the server, it can only be built on the basis of data on bars of standard timeframes. Keep in mind that the larger the timeframe, the rougher the build will be. The indicator has a selection based on standard timeframes.
At the first launch, you need to press the letter “R”on the keyboard or wait for the “Update period chart” specified in the settings, this will start the plot. If the indicator displays an error message about copying data (Copy error), then this action must be repeated later, since data is being copied from the server, which may take some time.
- If you choose a very long time period for analysis (early start date), then the construction may take a long time, since when the indicator is launched, a large amount of data is copied from the server;
- When testing in the Strategy Tester, the start date of the analysis should be selected earlier than the start date of testing by about a week or a month (depending on the selected step).
[spoiler title=”Read More…”]
- If you choose a very long time period for analysis (early start date), then the construction may take a long time, since when the indicator is launched, a large amount of data is copied from the server;
- When testing in the Strategy Tester, the start date of the analysis should be selected earlier than the start date of testing by about a week or a month (depending on the selected step).
Indicator Settings
- Magic number-Magic number-an individual indicator number is needed to run several indicators at the same time (each should have its own number);
- Period of the analyzed data – The period of the analyzed data-the indicator can be built from information about bars on different timeframes (the larger the timeframe, the coarser the construction is made);
- Update period chart-The update period of the chart construction – in order not to recalculate the chart construction on each tick, you can set a specific update time;
- Start date analysis – The start date of the analysis-the indicator performs analysis and construction only from the specified date;
- Type price for building – Type of price for plotting-as mentioned earlier in the description, you can build on data from different types of prices (High/Low, Open, High, Low, Close);
- Step-Step-the most important parameter for plotting a Range Bar chart, determines the size of the movement required to build a single Range bar.
[/spoiler]