


The indicator shows real waves based on the alternating upper and lower extremes of the price chart, thus displaying the wave structure of the market. When using this indicator, there is no need to manually apply the wave marking of the current timeframe.
During the determination of extremes, their relevance is determined, invalid extremes are not taken into account. The upper extremes are determined by the maxima of the bars, the lower extremes by the minima of the bars, and only one bar on each side of the bar on which the extremum is determined is taken into account. The wave detection algorithm has nothing to do with ZigZag. The indicator will be very useful for traders trading on the basis of wave analysis, applying the Elliott wave theory.
- QuantityOfBars – The depth of viewing the history in bars. If there is a large history in the terminal, it is necessary to limit the depth of viewing the history with the indicator.
- Working bar: from 0 to 2-A parameter that allows you to change the bar, at the end of which the indicator will determine the relevance of the last extremum.
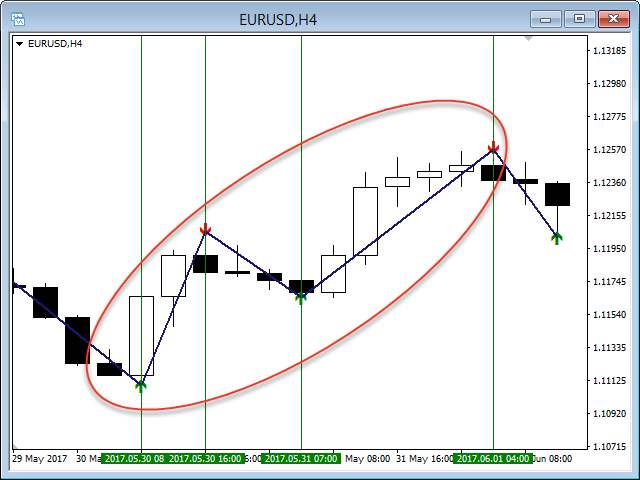
Screenshots 1-3 show examples of automatic wave marking on the H4, H1, and M15 timeframes, and you can also see how the waves of the H4 timeframe are decomposed into component waves on the lower timeframes-H1 and M15.