


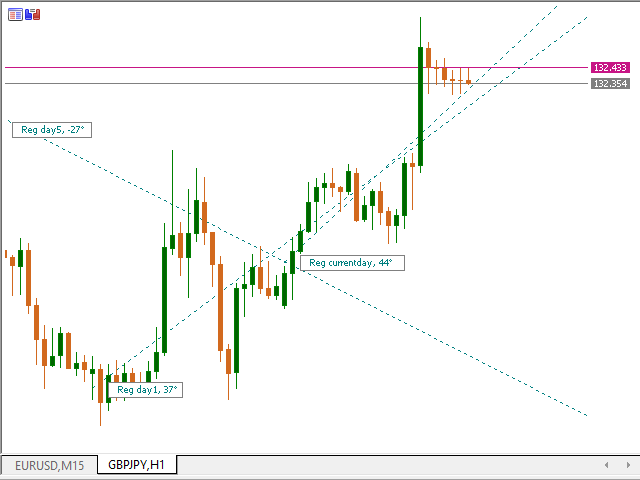

The Regression indicator shows the trend direction. The graph shows up to 3 regression lines with different time
periods. The straight line is plotted as the average inside the wave channel of the price movement (shown in one ScreenShot).
In this case, you can disable any of the lines. The indicator also allows you to change the color for each line. The calculation is interesting
the relative angle in degrees. You can also disable the angle display.
Thanks to this indicator, you can see the dynamics of trend changes over time.