


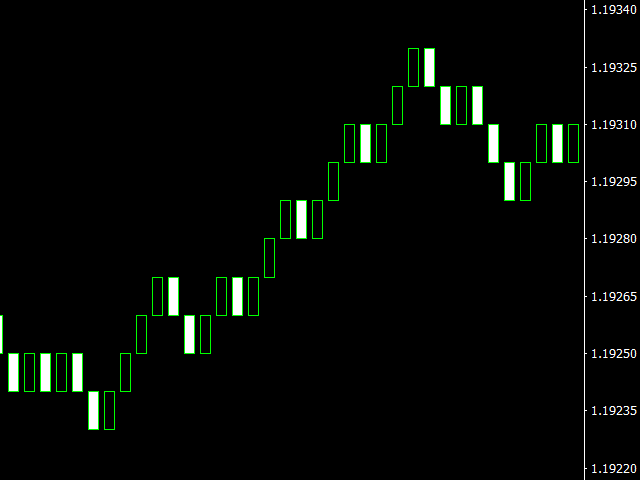

With this indicator, you can create Renko charts, where all the bars have the form of Renko – “bricks”. This type of graph is also
called a Quantum Chart, because of its special structure and the possibility of using it in quantum analysis. All bars on the chart
Renko is the same size and has no shadows, since shadows for this type of graph have no value. The size of the bar can be set in the
settings by changing the value of the Size parameter. You can attach indicators, expert Advisors, and scripts to the resulting chart. It turns out
a fully working schedule, on which you can work exactly the same as on a regular schedule.
The “Renko Chart” indicator makes constructions not only on the history, but also online. At the same time, the data is updated synchronously with the usual schedule,
there are no delays.
You can simultaneously create multiple Renko charts with the desired bar size.
- Size — the size of the Renko bars (in points).
- Chart-timeframe for opening the chart in a separate window. If you are going to work with only one chart for your currency pair,
then the timeframe is not important. When plotting a chart, the timeframe does not affect the calculations. This setting is created so that you can
open multiple charts for the same currency pair, but with different settings. In this case, you need to set different timeframes
for each graph (for example, M2, M3, M4). You also need to set different timeframes when running the “Renko” indicator at the same time.
Chart” and other tools that generate a synthetic chart on the same currency pair.
[spoiler title=”Read More…”]
- Open the Navigator window.
- Drag the indicator to the desired chart (timeframe M1 or older, depending on the value of the Size parameter).
- Open the resulting chart by clicking on the corresponding button — “Open Chart”.
[/spoiler]