


ReviewCandleChart is a unique product that allows you to check past price fluctuations using candlestick charts.
This indicator accurately reproduces price fluctuations in the past. It can make trading decisions (entry levels, take profit and stop loss)
many times so that you can learn the trade faster.
ReviewCandleCahrt is a great indicator for improving your trading skills.
ReviewCandleCahrt is suitable for both beginners and experienced traders.
Advantages of the indicator
- The indicator is designed to check price fluctuations on candle charts.
- Synchronization with the same currency pair.
- As with audio files (mp3), you can rewind, pause, or quickly jump to the price data you want
check. - After clicking on the start button, the candle to the right of the baseline will not be drawn.
- To synchronize, you can move the line even if the start button is turned off.
Download and try the free demo version of ReviewCandleChart(Trial) here: https://www.mql5.com/ru/market/product/26405
Version of the product without restrictions.
[spoiler title=”Read More…”]
Download and try the free demo version of ReviewCandleChart(Trial) here: https://www.mql5.com/ru/market/product/26405
Version of the product without restrictions.
After clicking on the start button:
A vertical baseline is added. Move it with the mouse to synchronize the graphs. Double-click to select and deselect the
vertical baseline.
Use keyboard shortcuts:
- R
- L
- F
- Z or X
- 4, 6, or 5 (Numpad)
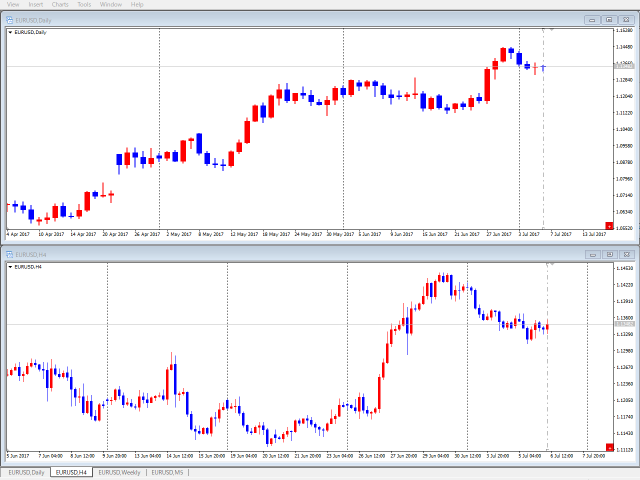
Synchronization of multiple timeframes. When moving the chart, candlesticks of synchronized pairs are plotted. If the moved graph is on the lower level
In the timeframe, the candle is built on the basis of the price of this period.
Before pressing the start button:
Use keyboard shortcuts:
- L
- T start button
Indicator Parameters
- Setting the vertical baseline
- always enabled-show even when the start button is disabled [false]
- color – line color, [Gray]
- style a – line style, [Dashdot]
- width – the width of the line when using a solid line, from 1 to 4, [1]
- Shift right (>=0) > – shift to display the right extreme candle – [1]
- Candle Settings
- bearish candle color – the color of bearish candles, [Blue]
- bullish candle color – the color of bullish candles, [Red]
- doji color – the color of the doji candles [Black]
- max bar counts (limit) – the maximum number of bars to calculate. See Note. [100000]
- Configuring Keyboard Shortcuts
- Step count – the amount of movement in bars, [1]
- next-move to the right, [Key_X]
- back – move to the left, [Key_Z]
- auto(next) – automatically move to the right, [Key_NUM6]
- auto(stop) – automatic stop of movement, [Key_NUM5]
- auto (back) – automatically move to the left, [Key_NUM4]
- redisplay-move the chart to the baseline, [Key_R]
- base line-move the base line to the displayed position on the chart, [Key_L]
- future – show / hide the graph to the right of the baseline, [Key_F]
- Start button
- button corner – button display angle, lower left or lower right, [Right Lower]
- x margin – horizontal margin, 0 and more, [0]
- y margin – vertical margin, 0 or more, [15]
- Bid Price Line
- enabled – enable the line, [true]
- color – line color, [Silver]
- style a – line style, [Solid]
- width – the width of the line when using a solid line, from 1 to 4, [1]
- Training mode
- execute with key on-hold down the specified key when pressing the start button, [Key_T]
- scale – display of scales, [show]
- show – show all
- date scale hide to hide the scale of dates
- price scale hide to hide the scale of prices
- hide date/price scale-hide the date and price
- randomly position-random determination of the displayed position, [false]
- Auto-play interval
- x1 – [1.8sec]
- x2 – [1.4sec]
- x3 – [1.0sec]
- x4 – [0.8sec]
- x5 – [0.4sec]
- interval -[0.4,0.8,1.0,1.4,1.8,4.0,6.0,8.0,10,15,20,25,30,35,40,45,50,55] sec
- always enabled-show even when the start button is disabled [false]
- color – line color, [Gray]
- style a – line style, [Dashdot]
- width – the width of the line when using a solid line, from 1 to 4, [1]
- Shift right (>=0) > – shift to display the right extreme candle – [1]
- bearish candle color – the color of bearish candles, [Blue]
- bullish candle color – the color of bullish candles, [Red]
- doji color – the color of the doji candles [Black]
- max bar counts (limit) – the maximum number of bars to calculate. See Note. [100000]
- Step count – the amount of movement in bars, [1]
- next-move to the right, [Key_X]
- back – move to the left, [Key_Z]
- auto(next) – automatically move to the right, [Key_NUM6]
- auto(stop) – automatic stop of movement, [Key_NUM5]
- auto (back) – automatically move to the left, [Key_NUM4]
- redisplay-move the chart to the baseline, [Key_R]
- base line-move the base line to the displayed position on the chart, [Key_L]
- future – show / hide the graph to the right of the baseline, [Key_F]
- button corner – button display angle, lower left or lower right, [Right Lower]
- x margin – horizontal margin, 0 and more, [0]
- y margin – vertical margin, 0 or more, [15]
- enabled – enable the line, [true]
- color – line color, [Silver]
- style a – line style, [Solid]
- width – the width of the line when using a solid line, from 1 to 4, [1]
- execute with key on-hold down the specified key when pressing the start button, [Key_T]
- scale – display of scales, [show]
- show – show all
- date scale hide to hide the scale of dates
- price scale hide to hide the scale of prices
- hide date/price scale-hide the date and price
- randomly position-random determination of the displayed position, [false]
- show – show all
- date scale hide to hide the scale of dates
- price scale hide to hide the scale of prices
- hide date/price scale-hide the date and price
- x1 – [1.8sec]
- x2 – [1.4sec]
- x3 – [1.0sec]
- x4 – [0.8sec]
- x5 – [0.4sec]
- interval -[0.4,0.8,1.0,1.4,1.8,4.0,6.0,8.0,10,15,20,25,30,35,40,45,50,55] sec
- interval -[0.4,0.8,1.0,1.4,1.8,4.0,6.0,8.0,10,15,20,25,30,35,40,45,50,55] sec
Yutaka
Okamoto, a professional programmer.
[/spoiler]