


ReviewCandleChart is a unique product that allows you to check past price fluctuations using candlestick charts.
This indicator accurately reproduces price fluctuations in the past. It can make trading decisions (entry levels, take profit and stop loss) many times so that you can learn the trade faster.
ReviewCandleCahrt is a great indicator for improving your trading skills.
ReviewCandleCahrt is suitable for both beginners and experienced traders.
- The indicator is designed to check price fluctuations on candle charts.
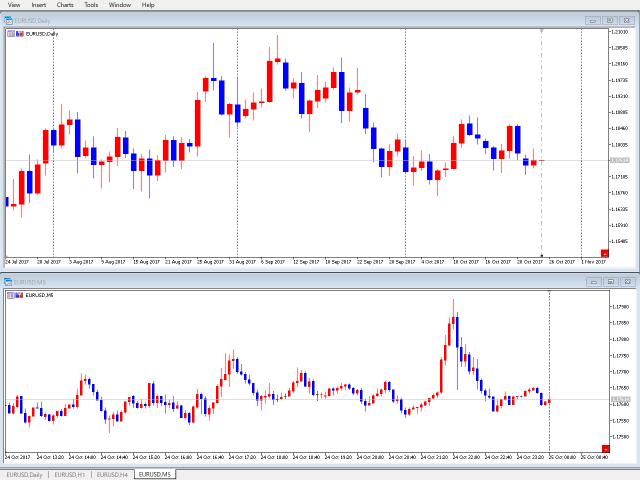
- Synchronization with the same currency pair.
- As with audio files (mp3), you can rewind, pause, or quickly jump to the price data you want to check.
- After clicking on the start button, the candle to the right of the baseline will not be drawn.
- To synchronize, you can move the line even if the start button is turned off.
ReviewCandleChart (Trial) – demo version of the indicator, which works only on the AUDUSD currency pair. Some features are also limited.
The unlimited version of the indicator can be purchased at the link:
ReviewCandleChart (Trial) – demo version of the indicator, which works only on the AUDUSD currency pair. Some features are also limited.
[spoiler title=”Read More…”]
The unlimited version of the indicator can be purchased at the link:
After clicking on the start button:
A vertical baseline is added. Move it with the mouse to synchronize the graphs. Double-click to select and deselect the vertical baseline.
Use keyboard shortcuts:
- R
- L
- F
- Z or X
- 4, 6 or 5 (Numpad) <- does not work in the demo version
Synchronization of multiple timeframes. When moving the chart, candlesticks of synchronized pairs are plotted. If the moving chart is on a lower timeframe, the candle is drawn based on the price of this period.
Before pressing the start button:
Use keyboard shortcuts:
- L
- T start button <- does not work in the demo version
- Vertical Baseline Settings
- always enabled-show even when the start button is disabled [false]
- color – line color, [Gray]
- style – line style, [Dashdot]
- width – the width of the line when using a solid line, from 1 to 4, [1]
- Shift right (>=0) > – shift to display the right extreme candle – [1]
- Candle Settings
- bearish candle color – the color of bearish candles, [Blue]
- bullish candle color – the color of bullish candles, [Red]
- doji color – the color of the doji candles [Black]
- max bar counts (limit) – the maximum number of bars to calculate. See Note. [100000]
- Configuring Keyboard Shortcuts
- Step count – move step in bars, [1]
- next-move to the right, [Key_X]
- back – move to the left, [Key_Z]
- redisplay-move the chart to the baseline, [Key_R]
- base line-move the base line to the displayed position on the chart, [Key_L]
- future – show / hide the graph to the right of the baseline, [Key_F]
- Start button
- button corner – button display angle, lower left or lower right, [Right Lower]
- x margin – horizontal margin, 0 and more, [0]
- y margin – vertical margin, 0 or more, [15]
- Bid Price Line
- enabled – enable the line, [true]
- color – line color, [Silver]
- style – line style, [Solid]
- width – the width of the line when using a solid line, from 1 to 4, [1]
- Ask Price Line
- enabled – enable the line, [true]
- color – line color, [Silver]
- style – line style, [Solid]
- width – the width of the line when using a solid line, from 1 to 4, [1]
- always enabled-show even when the start button is disabled [false]
- color – line color, [Gray]
- style – line style, [Dashdot]
- width – the width of the line when using a solid line, from 1 to 4, [1]
- Shift right (>=0) > – shift to display the right extreme candle – [1]
- bearish candle color – the color of bearish candles, [Blue]
- bullish candle color – the color of bullish candles, [Red]
- doji color – the color of the doji candles [Black]
- max bar counts (limit) – the maximum number of bars to calculate. See Note. [100000]
- Step count – move step in bars, [1]
- next-move to the right, [Key_X]
- back – move to the left, [Key_Z]
- redisplay-move the chart to the baseline, [Key_R]
- base line-move the base line to the displayed position on the chart, [Key_L]
- future – show / hide the graph to the right of the baseline, [Key_F]
- button corner – button display angle, lower left or lower right, [Right Lower]
- x margin – horizontal margin, 0 and more, [0]
- y margin – vertical margin, 0 or more, [15]
- enabled – enable the line, [true]
- color – line color, [Silver]
- style – line style, [Solid]
- width – the width of the line when using a solid line, from 1 to 4, [1]
- enabled – enable the line, [true]
- color – line color, [Silver]
- style – line style, [Solid]
- width – the width of the line when using a solid line, from 1 to 4, [1]
Setting the maximum number of displayed bars.
Menu Tools > Settings > > Charts > > > Max. bars in the window:
In the indicator settings, you must specify a value equal to or less than the value of the “Max. bars in the window”parameter.
Parameters > candlestick > > max bar counts(limit)
Set the value depending on the performance of your computer.
If there is no price data, an error message will be displayed.
>no data found[YYYY.MM.DD] previous data
Yutaka Okamoto, a professional programmer.
[/spoiler]