


Why do we need the RSI in a separate window, if it can be built in the main chart window, which is much more understandable?
RSI ANALYTICS is a market-tracking indicator based on the same idea as the traditional RSI (Relative Strength Index). At the same time, it is not built in a separate subwindow, but in the same window as the price chart of a financial instrument.
This indicator is based on the probability distribution, the input parameter for which is the traditional RSI.
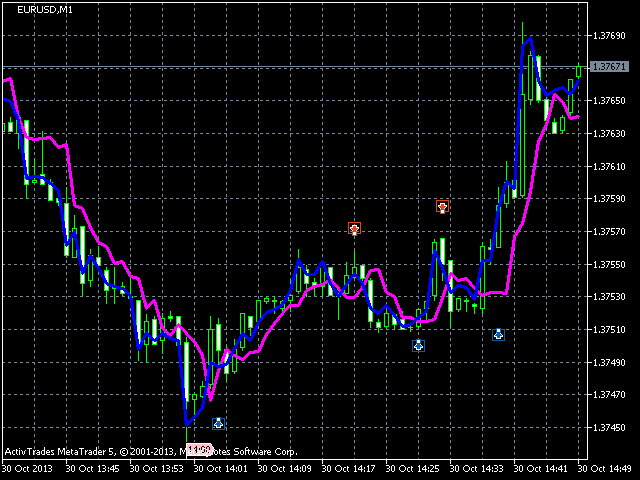
The indicator is built in the form of two lines: the blue one is called RSI Analytics buy, and the purple one is called RSI Analytics sell. Their intersection gives a signal of the beginning of a trend (or continuation, when the market is in a trend) or an overbought/oversold signal, when the market moves in a certain range. It is most useful when the market is volatile. It can be used on any timeframe. When the market is less volatile, it is recommended to use larger timeframes. As an optimal parameter, we use 4.