


Technical Indicator Relative Strength Index (Relative
Strength Index (RSI) is an oscillator following the price, which
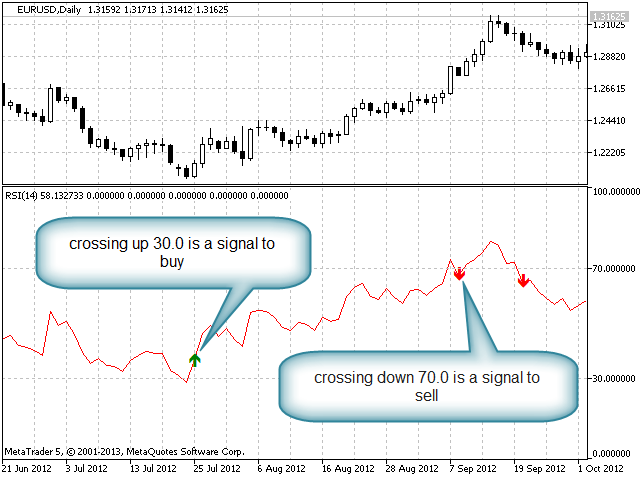
ranges from 0 to 100. Values below 30 are considered an oversold zone, values above 70 are considered an overbought zone. The classic interpretation of the readings is as follows: when the oscillator line exits the oversold zone, a signal appears to open a long position, and when it exits the overbought zone, a short one appears.
The indicator displays the position opening points as arrows on the chart.
Input parameters:
- Period RSI – period of the RSI indicator;
- Signal level in percent – the level that the line must cross in order to receive a signal to open a position.
Condition for opening a long position (green up arrow): the line crosses the Signal level in percent from the bottom up.
Condition for opening a short position (red down arrow): the line crosses from top to bottom the level 100-Signal level in percent, for example, if the default value of Signal level in percent is 30, this value will be 70.