


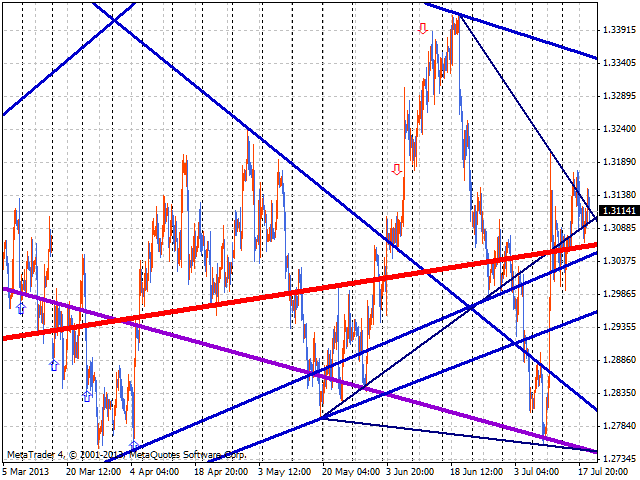

The RTrends indicator does two things: first, it automatically (on the fly) marks the price chart by drawing trend lines, and second, it gives bearish and bullish signals.
The markup reflects the fractal nature of the market. Trends from different time horizons are simultaneously plotted on the chart. Thus, a trader, having only one chart in front of his eyes, can see the trend lines from the higher timeframes. The lines, depending on the horizon, differ in color and thickness: the older the horizon, the thicker the line.
In order to simplify the settings, only 4 colors are used, they can be set via the indicator parameters. The three lowest displayed horizons have individual colors, the fourth and subsequent ones have the same color. This is justified by the fact that the older lines are quite rare. For example, on a minute chart for almost 14 years, the indicator highlights only about 10 horizons. The line markings (visible when you hover over the line) contain additional information. For example, the name Sup7_1 means a support line that belongs to the horizon with the conditional number 7 and has the number 1 on this horizon (numbering from zero). Similarly, the name Res5_0 means the resistance line number 0 from horizon 5.
[spoiler title=”Read More…”]
The indicator signals are divided into bullish and bearish, their main advantage is that they are very early signals. The flip side is a large number of “false” positives. Thus, they need additional filtering. It is correct to consider them as signals about the moment of making a decision (to enter/not to enter), and not as direct signals to open a position. The appearance of the signal is accompanied by the appearance of a pop-up window with additional information, these moments are marked with arrows on the chart. They can also be read from the indicator buffer. A bullish signal corresponds to a value of 1, -1 bearish, the no signal 0.
The indicator has the following parameters:
- DrawFrom sets the number of the horizon from which the trend display starts (i.e., the number of the lower horizon).
- SgnRank sets the rank of the signals.
- showAlert will enable / disable the appearance of a pop-up window when signals occur.
- Color1 sets the color of the lines of the lowest displayed horizon.
- Color2 and Color3 set the color of the lines of the two subsequent horizons.
- Color4 sets the color of the lines of the fourth and all subsequent horizons.
[/spoiler]