


This is a Dashboard indicator which uses 3LZZ Indicator in the background to find semafors.
It will give priority to the semafors3 because they specify a strong signal.
You can go through this video tutorial to see how it works:
Get all extra Indicators/Template from here:
https://abiroid.com/product/semafor-3lzz-scanner-dashboard
To use this template just specify “3LZZ” in Dashboard Property: “Use Template For New Window” (without the quotes)
What each button means (examples):
Green font 1 or 2 or 3: Bearish Semafor 1 or 2 or 3 on current bar
Red font 1 or 2 or 3: Bearish Semafor 1 or 2 or 3 on current bar
Orange 1/1 or 2/2 or 3/3: Both Bullish and Bearish semafors on current bar (very rarely occurs)
Green Block 3(4): Bullish Semafor 3 occured 4 bars back
Red Block 3(2): Bearish Semafor 3 occured 2 bars back
Letter S: Means Stochastic Crossed Overbought or Oversold in Stochastic Timeframe
[spoiler title=”Read More…”]
e.g.: If you keep Main TF: M15,M30,H1 and Stoch HigherTimeframes M30,H1,H4. So, for M15, stoch check will be done for M30.
– No semafors
— Semafor 3 in previous bars but hidden because higher timeframe has a current bar semafor
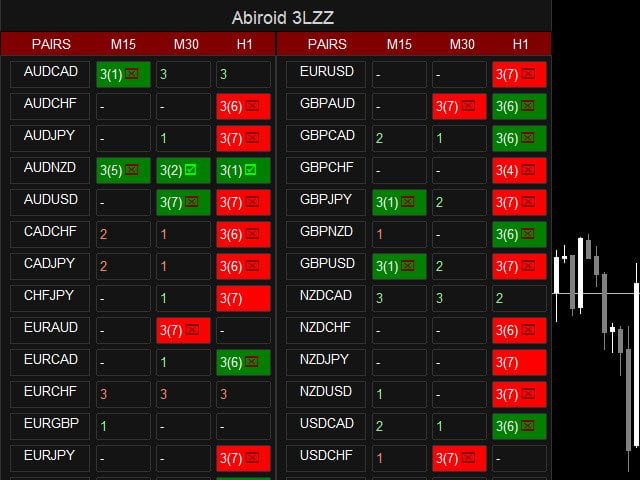
(See screenshots for examples)
Popup alerts or email alerts or push notifications. Can be specified in Indicator Properties.
– Specify your Own Pairs using a comma-separated list. Or you can select a pairs list from our drop-down for forex pairs like “Forex Core 7”, “Forex Core 14”, only AUD pairs, only JPY pairs, etc.
– Specify your own preferred time frames in a comma-separated list.
– Settings for showing alerts: Popup, email, sound alerts, etc.
– x_axis, y_axis: to position Scanner Dashboard
– fontSize: to resize the whole panel and it’s fonts. For best experience use fontSize between 5 and 8.
– ColumnsNum: Number of Dashboard Columns
– OnButtonClick Open New Window: On clicking any dash buttons open that Pair-TimeFrame in a new window with your specified template (next setting)
– Use Template for New Window: Template name without “.tpl”. Eg: Create a file Template1.tpl in templates folder and here specify: “Template1”.
(only works if previous property set to true). Does not work if on button click is set to open in current window because otherwise you might lose your current window indicators or existing dashboard settings.
– Check Previous Bars for Semafor 3: Specify number of previous bars to check Semafor 3 for.
– Skip If Semafor On Higher Timeframe: If true: If a semafor is still forming on a higher Timeframe then hide any previous semafors on the just lower timeframe. And just show double dash “–“
Because if higherTF semafor is still ongoing then price might still move. So it’s best to wait for bar to finish.
Alert Semafor On Bar 3(x): Show alert for semafor on (x) previous bar
Stochastic is OverSold/OverBought and back for BUY/SELL
Set different Stochastic values for higher timeframes.
E.g: Your main timeframes are M15,M30 and Stochastic TFs are M30,H1. Periods are 14,60. Overbought/Sold are 80,70 and 20,30.
Then for main M15, it will check HTF Stochastic for M30 with Period14 OB/OS: 80/20
And for main M30, it will check HTF Stochastic for H1 with Period60 OB/OS: 70/30
For BUY: Stochastic for Higher TF should cross below OverSold and close back above(for previous bar’s close)
For SELL: Stochastic for Higher TF should cross above Overbought and close back below(for previous bar’s close)
How to Trade:
Best way to use this indicator is with Support and Resistance. Or any indicators which might validate the reversal.
Support/Resistance levels will also help you set the SL/TP.
Important Note:
– Please don’t use too many Timeframes and too many Pairs because Scanner will need to scan each and every one and might get slower the more pairs you select.
– Scanner scans every bar only once for 3LZZ. But it refreshes every new bar. So for example, if your lowest timeframe on dashboard is M5, set the current chart timeframe to M5 too. So it will refersh every 5 minutes.
– Best is to trade trending markets. Don’t trade when market is sideways. Ranging markets will show unreliable signals.
– If you want price to be above the dashboard, then right click on chart -> Go to Properties (F8) -> Common Tab -> Check “Chart on Foreground”.
[/spoiler]