


- showsemafors – show or hide semaphores (default is true)
- periodlast-check the specified number of bars to see if they are below/above the current semaphore (default 12.0)
- periodpips-check whether the current High(Low) is higher(lower) than the previous High(Low) for
specified number of pips (default 34.0) - periodbars – the minimum number of bars required for the appearance of a new extreme
semaphore (default 234.0) - widthlow – width of the lower semaphore point (default 5)
- widthmed – width of the middle semaphore point (default 5)
- widthextr – width of the extreme semaphore point (default 5)
- barsCount – the number of bars to start drawing semaphores on the chart (by default, 3000)
- showtriangles – show or hide triangles (default is true)
- fillup-filling the triangle with the selected color (false by default)
- showmarks – show price labels on the sides of the triangle (default is true)
- buytriangle – color of the purchase triangle (blue by default)
- selltriangle – color of the triangle for sale (red by default)
- buymark – color of the purchase price tags (blue by default)
- sellmark – color of price tags for sale (red by default)
- Width – the thickness of the triangle lines (default 3)
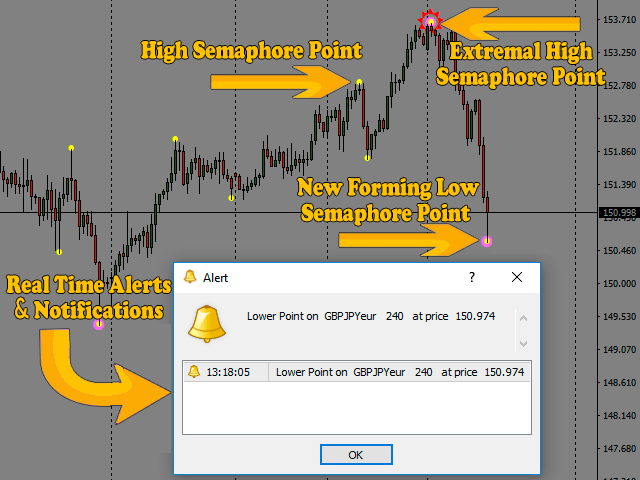
- showAlert – notification in the terminal for semaphores (by default true)
- showalerttr – notification in the terminal for triangles (by default true)
- pushalert – push notification for semaphores (default is true)
- pushalerttr – push notification for triangles (default is true)
[spoiler title=”Read More…”]
- The default indicator settings are the most effective.
- If you want to experiment and try different settings, open “List of indicators“, select
”ai_semaphore ABC” and open the tab “Input parameters“.
- Instructions for configuring input parameters are shown in the screenshots.
Check the entered number of bars to see if they are below/above the current semaphore.
[/spoiler]