


The Sensitive Signal ( SS) indicator, using the filtering methods developed by the author (which include cluster multicurrency analysis), allows you to set the beginning of a true (filtered from interference – random price walks) trend movement with a high degree of probability, which is very effective for trading. The filtering developed by the author is carried out in several iterations and reveals the true trajectory of a regular price movement (more precisely, the most likely curve of such a movement) and draws it.
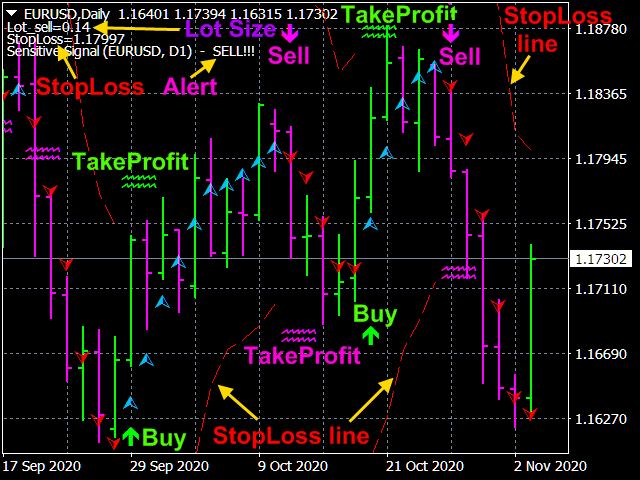
The indicator readings are clear, extremely simple and do not require comments. The blue triangles are located on the uptrend of the natural component of the price movement, the red triangles are located on the downtrend. Accordingly, the entry points for Buy, when the red triangles are replaced by blue ones, and for Sell – vice versa. The sensitivity level of the indicator is adjusted by setting “Select sensitivity level“. At the same time, you need to understand that increasing the sensitivity level not only reduces the delay of the signal (which is generally not enough for all levels), but also increases the probability of issuing a false signal.
[spoiler title=”Read More…”]
Possible moments of changing the direction of the price movement are also marked with arrows, which are never redrawn under any circumstances.
Possible moments of changing the direction of the price movement are also marked with arrows, which are never redrawn under any circumstances.
The indicator calculates and displays the position linesStopLoss, calculated based on the current price probability distributions and the selected level of probability of closing an order for StopLoss before the trend reversal. The indicator also considers TakeProfit as the most likely value reached by the price after the signal.
The indicator also has a built-in money management function, where you can calculate the lot size based on the accepted risk level, the deposit size and the StopLoss position .
The indicator also has a built-in money management function, where you can calculate the lot size based on the accepted risk level, the deposit size and the StopLoss position .
The indicator has all types of alerts. Three algorithms for enabling alerts have been developed. The notification can be activated: 1) if the indicator’s indications match (for the direction of the trend) on the last two bars; 2) on a closed candle; 3) on the closed candle and the bar preceding it.
The indicator settings.
- Price type – The price type. Values: Close price, Open price, High price, Low price, Median price ((high low)/2–default), Typical price ((high low close)/3), Weighted price ((high low 2*close)/4).
- The averaging method – The averaging method. Values: Simple, Exponential (default), Smoothed, Linear weighted.
- The averaging period – The averaging period. Any integer (14 by default).
- Select sensitivity level – The sensitivity level of the indicator. Values: Low, Middle( default), High.
- Dimensions of markers – The size of the markers display the signal. Values: any integer (2 by default).
- The display method – Method for displaying information. Values: Show trend arrows and show change trend arrows ( default), Show only trend arrows, Show only change trend arrows.
- Show StopLoss and TakeProfit lines? Show linesStopLoss and TakeProfit? Values: true (default), false.
- Trend UP arrow color= DeepSkyBlue – Color of the downtrend line (arrow).
- Trend DOWN arrow color=Red – The color of the uptrend line (arrow).
- Down arrow color=Magenta – The arrow is the beginning of a downtrend.
- Up arrow color=Lime – The arrow is the beginning of an uptrend.
- Signal Identification Method –Methods of signal identification. Values: By the last two bars (“By the last two bars” – by default), By closed candle (“By closed candle“), By closed candle and by the previous for it bar (“By the closed candle and the bar preceding it“).
- The Signal method – Type of trading signal notification. Values: No, Send alert, Print (in expert), Comment (in chart), Sound Print, Sound Comment, Sound, Push Comment, Push, Mail Comment, Mail.
- The probability of triggering StopLoss P_sl – The probability of closing an order byStopLoss until the trend reverses. Any real number from 0 to 1 (0.05 by default).
- Calculate the lot size from the risk, deposit and P_sl? – Calculate the lot size based on the risk, the deposit and the probability of closing the order byStopLoss? Values: true, false (default).
- Deposit in $ – the amount of the deposit in dollars ($5000 by default).
- Allowable losses in % – Acceptable losses as a percentage of the deposit (2% by default).
[/spoiler]