


The indicator automatically detects Elliott Waves on any timeframe and displays them on the chart based on complex algorithms.
- Searches for points and draws lines automatically
- Ease of use
- The most advanced Elliott Wave indicator
- You can use it as part of an Expert Advisor
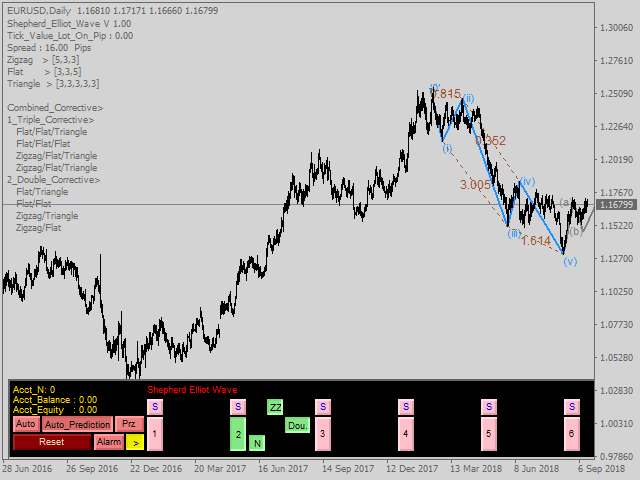
When a wave pattern appears, enter the market and keep the trade open until the price reaches the potential price rectangle. Keep in mind that this doesn’t always happen. I recommend installing the indicator on several timeframes with several zigzag values to see all the models.
- Use_System_Visuals-enable / disable system styles
- Bearish_Wave_Color – the color of the bearish wave
- Bullish_Wave_Color – the color of the bullish wave
- More_Accuracy-enable / disable the accuracy of waves (waves are plotted using custom Fibonacci proportions)
- FontSize – font size for all texts created by the indicator
- FontColor – font color for all texts created by the indicator
- Proportions_View – show / hide proportions
- Proportions_Color – the color of the proportions
- Potential_Reverse_View – show / hide the rectangle of the potential U-turn
- Show_Targets – show / hide the rectangle of the potential target value
- Targets_Color – color of the target level
- CountBars-historical bars for calculation
- zzDepth – zigzag depth
- zzDev-zigzag deviation
- zzBack – return of the zigzag
- UseAlert – enable / disable alerts
- UseNotification – enable / disable push notifications
- UseMail – Enable / disable email notifications
- Use_Panel-enable / disable the information panel
[spoiler title=”Read More…”]
- If you have any suggestions, write them in the comments.
- Feedback is welcome.
[/spoiler]