


we’ll analyze what’s your supply and demand, and how relevant is the expression “economy memory”. The screenshots show the work of the indicator of our development SupDem-Pro, it is a better version of my previously written indicator Shved Supply and Demand. To create it, gave up trading to almost 3 years and studied a great deal of literature, at this time I did not commerce, but just analyzed the price behavior in various situations. It required quite a long time for me to properly formulate the task for the developer. The graph hunts for zones in which there is a violation of the balance between supply and demand (buyers and sellers) and displays them on charts for any instruments and time frames. Red zone – zone of the proposal, which is dominated by sellers. Green zone demand zone which is dominated by buyers.
The Eur/Usd chart is 4 hours long. The circle marks the formation of supply and demand zones. At point 1, most likely, there are already experienced traders who are set to sell, because they know that their chances of the price starting to decline are above 50%. This is the first test of the offer zone, and sellers win over annoying buyers. But the buyers, having gathered their courage, managed to stop them at point 2.
[spoiler title=”Read More…”]
At point 3, the sellers are still in the lead – they still keep selling, but it’s getting harder and harder to hold back the buyers. This is the second test of the zone – the price has passed even higher from the previous high of point 1. Point 4-test zone. At point 5, there was just a war between buyers and sellers, which lasted for a whole day, each side resisted to the last, but still at the end of the day, buyers won and began to push the price higher and higher with almost no kickbacks.
However, the sellers prepared for the next meeting at point 6 and were already ready, buyers had little chance to take them by storm. Points 7,8,9,10 show how the price reacts to the supply and demand zones. At points 11, 12, 13, we are approaching the demand zone on the daily chart, and the price gradually slows down. At point 14, it comes close to the demand zone, and on the daily chart, the result is a movement of 450 points.
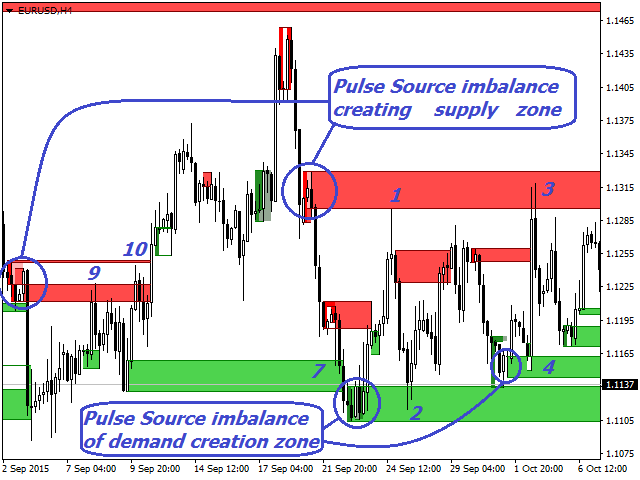
Let’s analyze the price movement marked on the Eur/Usd H4 chart as a slice of A-A only on the smaller time frame H1 to understand how the supply and demand zones work under the microscope, so to speak. Our movement was on December 3.
Circles indicate the formation of supply and demand zones. At points 1,2,3, you can clearly see how the price is trying to overcome the supply zones formed earlier. After the price fails to overcome the supply zone at point 3, it rolls back to the nearest demand zone that was recently formed. The reaction to these zones is the price behavior at points 4 and 5. After the correction, the price still pushes through the supply zone at point 6. But it can’t go higher yet, because it is limited to the last supply zone, which could not be broken through on H4. After consolidation, the price again looks for the nearest demand zone, the reaction is points 7 and 8. On the way up, there will be another fresh supply zone – the reaction of point 9, 10, 11. After the failure, the price starts moving to the nearest zones, points 12, 13, 14, 15.
Bottomline: There are supply and demand zones everywhere and always on any instrument and any time frame – these are the basic laws of the market, novice traders should start with this.
If you are trading on the supply and demand zones, you should analyze the situation for the instrument on all available time periods. Because the demand zone on one time frame can be located, for example, in the supply zone on a lower or higher time frame. Therefore, keep this in mind – when testing in demo mode (only 1 timeframe), the zones will work out and will be broken, this will always happen, just one side (buyers or sellers) can not control the supply or demand zone forever, someone always wins.
This indicator is used for detailed analysis. It is able to display the supply and demand zones for any instrument and time period (M5,M15,M30,H1,H4,D1, W1). Also, you should always remember that any, even the strongest movement can be stopped by a zone on a lower or higher timeframe.
Success in trading.
[/spoiler]