


A period of low volatility and non-trend movement in the financial market is considered a Sideways Market period. Sooner or later, the volatility starts to increase and the market goes into a trend phase. The company side of the market (fleta) it can serve as a good time to enter the market. In addition, the side market often means the accumulation of large investors ‘ volume orders in the market. Information about flat market dominance can help you identify good points to enter and exit the market.
Traditionally, the ADX indicator (Average Directional Index, directional movement indicator) or the moving average of standard deviation indicators were used to determine the presence of a flat in the market. However, both indicators lag behind and have a very low correlation with future price movement. They do not give a clear answer to the question of when the flat started and when it will end. As a result, traders get a very fuzzy picture of the current state of the market.
Sideways Market Analyzer is a very accurate indicator based on the theory of statistics. The indicator is able to detect flat states in the same way as traders themselves do. In addition, the indicator shows the potential outcome of trading on the detected side market. That is, you know in advance what profit/loss you will get if you enter the market during the detected flat. Based on the results of the 9-month backtest, you can expect between 300 and 1,000 pips of profit each month when trading with the Sideways Market Statistical Analyzer.
[spoiler title=”Read More…”]
You buy when the price breaks through the upper limit of the detected flat, and sell when the price breaks through its lower limit. Sideway Market Analyzer sets fixed stop loss and take profit levels. The indicator works well on most currency pairs. Below are the results of testing on the history of five currency pairs over a 9-month period. When trading five currency pairs, you can expect between 300 and 1,000 pips per month. These results are based on the assumption that you open buy and sell trades when a flat is detected without using other indicators. Of course, using additional technical indicators, you can weed out unprofitable trades and further increase the efficiency of your trading.
For XAUUSD (gold) socr. probability = 0.15, deviation value = 0, take profit = 1.3, lot multiplier = 1.6, total net profit for 9 months = 27,265 pips with a monthly profit of 2,870 pips. Thus, the indicator is also suitable for gold.
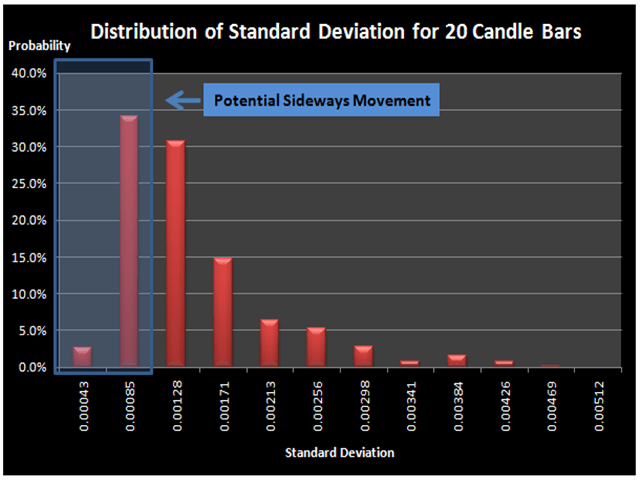
- Cut Probability – you can enter from 0.01 to 0.99. The value will mostly stay between 0.05 and 0.5. This cut probability is the criteria to qualify the Sideways Movement of the current group of candle bars based on the probability distribution.
- Box Buffer Pips – you can enter from 0 to 100. The value will mostly stay between 0 and 10. The pip value is the offset distance from the detected Sideways Market. This will be represented by the long horizontal line above and below the detected Sideways Market on your chart. This line can be used as the trigger point for your buy and sell orders.
Just as the Harmonic Pattern Plus and Price Breakout Patterns Scanner indicators can be combined to improve efficiency, so the Sideways Market Statistical Analyzer can be combined with any of the mentioned products. All three indicators can also be combined. I have found that a flat is often detected simultaneously with large harmonic and breakdown patterns. When the three products are used together, the reliability of the found model is significantly increased. On this web page, you can learn how these models work together (in English) to create your own effective trading strategy.
[/spoiler]