


The indicator is a trading strategy. It is based on 3 standard indicators: two moving averages (MA) and an index relative to strength (RSI). The indicator signals are the intersection of moving averages and the simultaneous location of the RSI indicator relative to the 50 level. If the fast moving average is higher than the slow moving average and the RSI indicator is above the 50 level, purchases are assumed. If the fast moving average is below the slow moving average and the RSI is below the 50 level, sales are assumed.
- bar_limit-limit the display of the indicator on a given number of bars, at = 0 it is displayed on all available bars.
- Period_FastMA – the period of the fast moving average.
- Period_SlowMA – the period of the slow moving average.
- Period_RSI – the period of the RSI indicator.
- ma_method_MA is a method for averaging moving averages.
- appliced_price_ma – the price of the moving averages used.
- appliced_price_rsi – the price used for the RSI indicator.
- Alerts-Displays a dialog box containing user data.
- Text_BUY – Custom text for the buy signal.
- Text_SELL – Custom text for the sell signal.
- Send_Mail-Sends an email to the address specified in the settings window on the “Mail”tab.
- subject – The title of the email.
- Send_Notification-Sends a notification to mobile terminals whose MetaQuotes IDs are specified in the settings window on the “Notifications” tab.
- color_text – the color of the text of the name of the periods for the information tableau.
- coordinate_x – the X-axis coordinate for the information board.
- coordinate_y – the Y-axis coordinate for the information board.
- _corner – the angle of the graph for linking the information tableau.
- color_flat – the color of the flat border (frame) for the information board.
- color_up_trend – the background color for the indicator values indicating an upward movement.
- color_dn_trend – the background color for the indicator values indicating a downward movement.
- color_up_flat – the background color for the indicator values indicating an incomplete upward movement.
- color_dn_flat – the background color for the indicator values indicating an incomplete downward movement.
[spoiler title=”Read More…”]
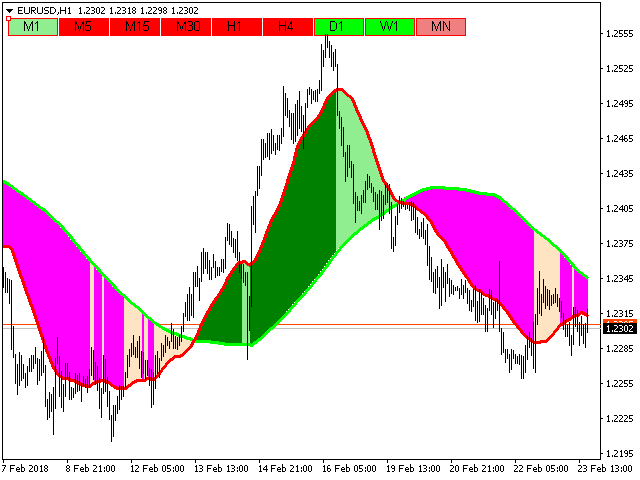
The information board displays the indicator readings from all available periods of the chart.
To move the information board to any point on the chart, you need to hold the upper-left corner with the left mouse button and move it, the shift will occur with the arrival of a new tick.
[/spoiler]