


In the terminal
‘s toolkit, you can add signals. If you have used
signals, you know how convenient it is. I specified the price and the terminal will
“call” you when you need it. But when you need to change the signal parameters frequently, it
becomes very inconvenient.
The Signal Lines tool was created to simplify the work
with signals and make it more visual and understandable. In my
arsenal of tools, this one is the most commonly used, without it as without
hands.
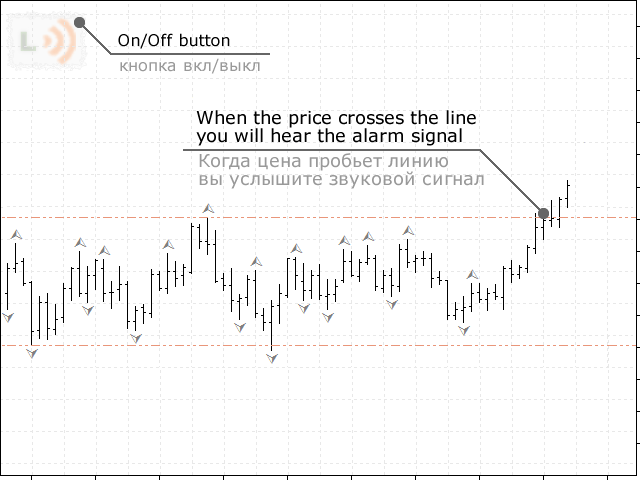
The tool will place lines on the chart that you can
move. When the price breaks through one of the lines, you will hear
an alert signal. There is also a useful function.
If you have an open position on the current instrument, the line
it will show what the profit will be at its price.
Details on the website www.profits4all.org
|
Off/On status of the module true-enabled (by default) false – disabled | The status of the module’s inclusion. This option is useful when the tool is not used as an independent Expert Advisor, but is located in the tools container. | |
|
Profile name for the settings custom text string (default – ‘default’) | If you want to have different settings for different graphs of the same symbol, such as line position or on-line status, you can specify different profile names, thereby separating their settings. | |
| Show the profit in the line description true-show (default) false – do not show | Show profit in the line description. If you have a position open on the current instrument, the line will show what the profit will be at its price. That is, you can, for example, drag the line to the place where you plan to exit the market, and the line will show what profit will be in that place. The profit is calculated based on the volume of your open position. | |
|
Show the profit even if there is no opened position true-show (default) false – do not show | Show profit even if there is no open position on the current instrument. In this case, the line will show the profit from the current market price to the line price with the pre-set position volume (see the next parameter). With this data, you can easily calculate the potential profit or loss for calculating the risk. Always useful information and at your fingertips. | |
|
Lot to calculate profit unless no opened position floating point number (default is 0.1) | Lot (position volume) for calculating profit if there is no open position. | |
|
Display the period when you drag the line true-show (default) false – do not show | Display in the line description the period in which the line was last moved, so as not to forget the period. Use it at your discretion. | |
|
Reset the line position for quick reactivation true – yes (default) false – no | Position the lines in the visible part of the graph when the module is actively reactivated. For example, if the lines are located beyond the horizon of the visible area, and you need to place them here and now, you can quickly turn on-off-turn on the module, and the lines will be placed in the visible part of the graph. Let’s just say, the ability to call the lines closer. | |
|
The number of seconds between the audio alerts integer number (by default, 180 = 3min.) | The number of seconds between sound alerts. If you are waiting for a very important price, you can reduce this interval, and the terminal will call you more often. | |
|
The sound alarm file name (from the folder ‘Sounds’) text string (default is ‘tick.wav’) | The name of the audio file that will be played, notifying you of the contact of the market price with the line. The sound files are located in the Sounds folder of the terminal. You can choose the right sound for you, as well as add your own. | |
|
The color of active line colour (default is DarkSalmon) | The color of the active line. The line will be colored in this color when the module is turned on and ready to notify you. | |
|
The color of inactive line colour (by default, LavenderBlush) | The color of the inactive line. The line will be colored in this color when the module is disabled. I recommend choosing a color close to the background color of the chart, so that the disabled line is not visible. | |
|
The On/Off button color one of two colors (default is auto) | The color of the button. If you use a light background for the chart, select the light button, and if it is dark, select the dark button. There are 2 button options. | |
|
The On/Off button offset integer number (default is 10) | Offset of the button from the top of the chart. | |
|
The offset of the lines description to the right an integer from 0 to 40 (default is 0) | Offset of the line description to the right. Sometimes it is necessary when the descriptions overlap with the description of stop levels and open positions. |