


The basic principle of spread trading (pair trading) is to find two assets (stocks, indices, commodities) that correlate well with each other on historical data. Despite this long-term correlation, sometimes the price of asset A can fall or rise significantly compared to asset B. This may happen after the release of important news or as a result of market fluctuations that lead to a divergence in the prices of assets A and B.
The most popular strategy in the framework of pair trading is “return to mean” (“Return to mean”). This strategy assumes that the prices of the two assets will sooner or later return to their average value and again begin to correlate with each other.
Thus, if asset A becomes sharply cheaper relative to asset B, we buy A and sell B at the same time in the same volume. Accordingly, if asset A sharply increases in price relative to asset B, we sell A and buy B. Thus, we hedge the position, and we no longer care about the direction of the market. It is important to us that the situation with asset A develops better than with B. Even if both assets fall in price, there is nothing wrong with this, provided that B becomes cheaper more than A. By saying “in the same volume”, I mean that the funds involved in opening both positions should be the same. For example, if you bought asset A for $ 10,000, then you should sell asset B for the same $ 10,000.
[spoiler title=”Read More…”]
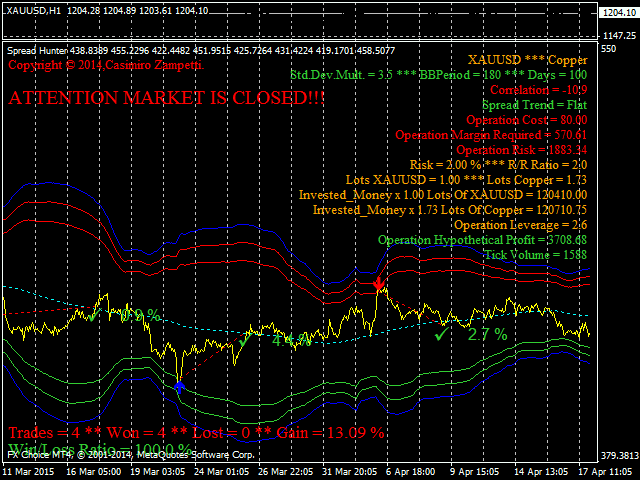
To estimate the deviation from the average value, the Bollinger band is used. When the spread goes out of the band and then returns, the Spread Hunter sends a signal.
The quality of the signal depends on the period of the Bollinger band and the deviation coefficient relative to the history and correlation of the two assets.
SPREAD HUNTER performs the necessary calculations AUTOMATICALLY, you only need to select two assets!
SPREAD HUNTER displays the results of the backtest with the most optimal settings found for the corresponding period (the DaysBack parameter), and recalculates every day.
- SubSymbol – the second symbol, the first one is displayed on the chart.
- DaysBack – the number of days to display the spread.
- MinProfPercent-profit filter: if the potential profit is less than the parameter value, the signal is not displayed.
- AutoBBPeriod – if true, the Bollinger band period is calculated automatically.
- BBPeriod-set the Bollinger band period manually if AutoBBPeriod = false.
- AutoKstd – if true, the standard deviation of the Bollinger band is calculated automatically.
- Kstd-set the standard deviation manually if AutoKstd = false.
- Risk – if > 0, Spread Hunter calculates the asset lot size as a % of the account balance.
- R_R_Ratio – risk / reward ratio.
- Invested_Money – the amount invested when Risk = 0.
- Alert_ – if true, Spread Hunter shows a pop-up notification when a signal appears.
- SendMail_ – if true, Spread Hunter sends an email when a signal appears.
[/spoiler]