


Latest Update :
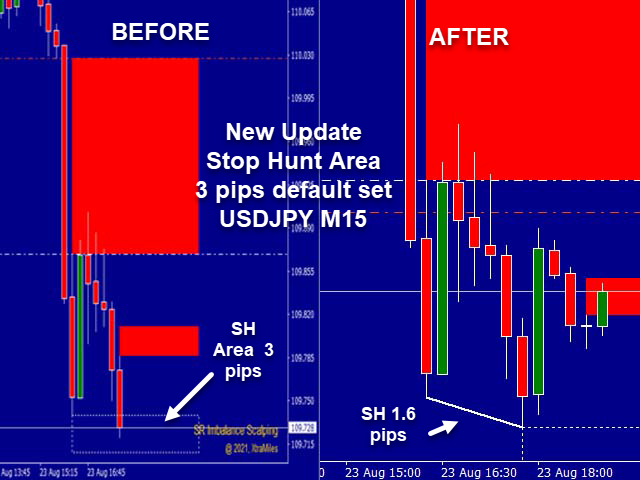
– Added Feature : Stop Hunt Area. Use the feature to see Stop Hunt Area on lower time frame. Price will reject on the area or break the area to continue its movement. This will help your judgement whether to place market order buy or sell depends where it goes after it enters the area. Default set for SH area is 3 pips, you can change to how many pips as you like based on your experience.
You can see how the indicator runs on the video below. Spotting Imbalance and Order Block will be easier on any timeframe and currency :
if you cannot see it, just go to
SR Imbalance Scalping is a new way of scalping based on price imbalance. Price imbalance happens when price moves rapidly because of lack of buyers or sellers. It is believed that price will get back to where imbalance formed before continuing its move to a certain direction. This indicator captures those imbalances and forms rectangles as area of imbalances. After months of investigation using this indicator, we note that many times price won’t come inside imbalance area. Instead it just touches the rectangle line and continues moving away off the area. This makes the area as perfect support and resistance area, and we trade based on that.
[spoiler title=”Read More…”]
If you are trading with Smart Money Concept, now we are adding Order Block to enable you spot the most possible area that the price might touch and rejected.
Imbalance or Fair Value Gap and Smart Money Concept are introduced by ICT and we value his contribution very much. Treating imbalance as Support and Resistance is merely based on our experience.
The indicator will spot Imbalances and or Order Blocks on the time frame you choose with your chosen colors. Treat both of them as areas of support/demand and resistance/supply. We recommend using H1 – D1 time frame for better result.
How to use it :
1. Open H1-D1 chart of any currency.
2. Attach SR Imbalance Scalping indicator to the chart. You will immediately see some imbalances (as support and resistance areas) on the chart if any.
3. Look at the current trend based on the time frame. Place limit order at exactly at the lower rectangle line of imbalance (red rectangle) or at exactly the upper rectangle line of imbalance (blue rectangle). Put SL (stop loss) on the other rectangle line.
Note :
– Rectangle will immediately disappear if not valid anymore. Now you can set validity with the new feature. Validity works on future rectangle areas only and areas which have not been touched by price.
– Save the indicator into a template so that whenever you are away of your keyboard and want to make sure you have the fresh imbalance spot, you can reload the template at anytime.
– Do not use Symbol Changer indicator or any means to switch chart within the same chart window. Open separate chart for each symbol instead.
[/spoiler]